Table Of Content
- Executive Summary: The Digital Divide Creates Market Opportunities
- Understanding India’s Digital Foundation: Infrastructure and Accessibility
- Current Digital Landscape Statistics
- Metro Cities Digital Infrastructure
- Tier 2 Cities Digital Growth
- Digital Payment Revolution: UPI as India’s Great Equalizer
- The UPI Phenomenon: Numbers That Tell the Real Story
- UPI Adoption Patterns: Metro vs Tier 2 Cities Deep Dive
- The UPI Democratization Effect
- Cash-on-Delivery vs UPI: The Coexistence Strategy
- The UPI Ecosystem’s Business Impact
- E-commerce Engagement: Sophistication vs. Pragmatism
- Shopping Journey Complexity Analysis
- Platform Preferences and Usage Patterns
- Mobile-First Behavior: The Convergence Point
- Device Usage and Data Consumption Patterns
- Language and Content Engagement
- Social Media and Digital Community Dynamics
- Platform-Specific Engagement Analysis
- Influencer Marketing and Trust Patterns
- Financial Behavior and Credit Adoption Patterns
- Digital Financial Services Penetration
- Spending and Savings Behavioral Analysis
- Healthcare Digital Adoption: Post-Pandemic Acceleration
- Telemedicine and Digital Health Services
- Education Technology: The Learning Revolution
- Online Learning and Skill Development
- Brand Loyalty and Trust Development Mechanisms
- Trust Building Pattern Analysis
- Loyalty Program Effectiveness
- Government Digital Services: UPI as the Foundation Effect
- Digital Governance and Payment System Integration
- Policy Impact: UPI-Enabled Financial Inclusion
- Regional Variations Within Tier 2 Cities
- High-Growth Tier 2 Clusters
- Strategic Brand Recommendations: Leveraging the UPI Advantage
- UPI-First Strategy for Metro Markets
- UPI-Enabled Tier 2 Market Penetration
- UPI-Powered Business Model Innovations
- UPI Success Metrics for Brand Performance
- Cross-Tier Integration Framework
- Government Schemes and Startup Opportunities
- Digital India Policy Impact
- Available Government Funding for Digital Adoption Solutions
- Eligibility Requirements for Government Schemes
- Technology Infrastructure Recommendations
- For Startups Targeting Digital Adoption
- For Enterprise Digital Transformation
- Success Measurement Framework
- Metro Cities Performance Metrics
- Tier 2 Cities Performance Metrics
- Future Outlook: Digital India 2030
- Emerging Technology Integration
- Policy Evolution Expectations
- Conclusion: Navigating India’s Digital Transformation
- Frequently Asked Questions (FAQ)
- What is the difference between tier 2 and metro cities in digital adoption?
- How has UPI changed consumer behavior in tier 2 cities?
- What are the key digital payment trends in India 2025?
- Which government schemes support digital adoption startups?
- How do brands succeed in tier 2 cities vs metro cities?
- What is the mobile usage difference between tier 2 and metro consumers?
- How important is language preference in digital adoption?
- What are the trust-building requirements for tier 2 consumers?
- Which digital services show highest adoption in tier 2 cities?
- What is the future outlook for digital adoption in tier 2 cities?
The digital landscape in India has fundamentally transformed how consumers interact with brands, services, and technology across different city tiers. As a Mentor for change with NITI Aayog who has witnessed India’s digital evolution from the corridors of governance to ground-level implementation, I present this comprehensive analysis of Indian consumer digital adoption patterns that will reshape your understanding of India’s diverse market dynamics.
This data-driven examination reveals critical insights into how tier 2 vs metro cities demonstrate distinct digital behaviors, creating unprecedented opportunities for brands ready to decode India’s complex consumer ecosystem.
Executive Summary: The Digital Divide Creates Market Opportunities
Indian consumer digital adoption patterns in 2025 represent more than mere technology penetration statistics. They reflect evolving trust mechanisms, value consciousness, and behavioral sophistication that vary dramatically between tier 2 cities and metro cities. Understanding these patterns is crucial for brands aiming to capture India’s expanding digital economy effectively.
Critical Insights Overview:
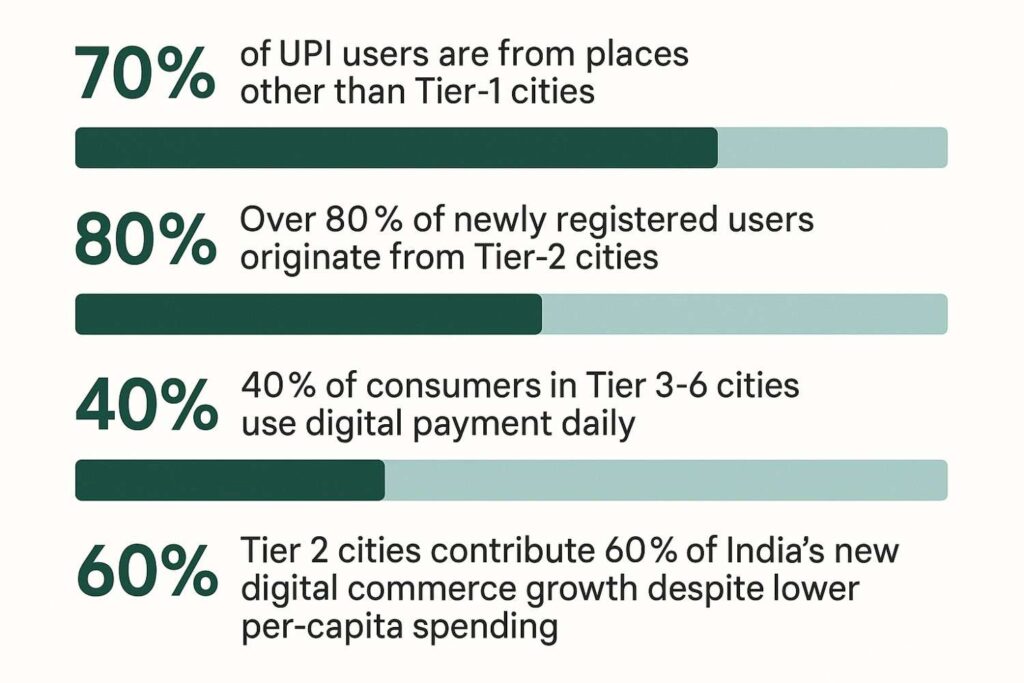
- 70% of UPI users are from places other than Tier-1 cities
- Over 80% of newly registered users originate from Tier-2 cities
- 40% of consumers in Tier 3-6 cities use digital payment daily
- Tier 2 cities contribute 60% of India’s new digital commerce growth despite lower per-capita spending
Want the Complete Picture of Indian Consumer Behaviour in 2025?
This article is part of our deep-dive series. For the full strategic insights—covering trends, data-backed shifts, and actionable brand strategies—read our flagship research:
👉 Consumer Behaviour in India 2025: Trends, Insights & Strategies for Brands
Understanding India’s Digital Foundation: Infrastructure and Accessibility
Current Digital Landscape Statistics
India’s digital population has surged over 751 million active users as of January 2024, driven by government initiatives and improved infrastructure accessibility. However, 683.7 million people in India did not use the internet at the start of 2024, suggesting that 47.6 percent of the population remained offline.
This digital divide creates distinct market segments with varying adoption patterns, consumer behaviors, and business opportunities across tier 2 cities versus metro cities.
Metro Cities Digital Infrastructure
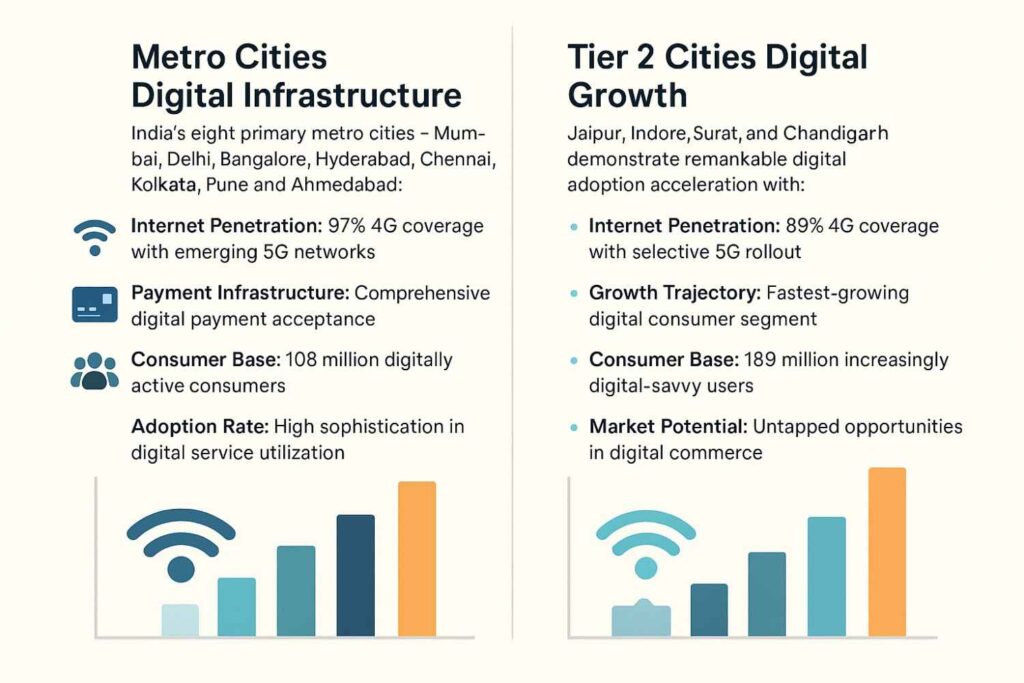
India’s eight primary metro cities – Mumbai, Delhi, Bangalore, Hyderabad, Chennai, Kolkata, Pune, and Ahmedabad – serve as digital innovation hubs with:
- Internet Penetration: 97% 4G coverage with emerging 5G networks
- Payment Infrastructure: Comprehensive digital payment acceptance
- Consumer Base: 108 million digitally active consumers
- Adoption Rate: High sophistication in digital service utilization
Tier 2 Cities Digital Growth
Tier 2 cities including Jaipur, Indore, Surat, and Chandigarh demonstrate remarkable digital adoption acceleration with:
- Internet Penetration: 89% 4G coverage with selective 5G rollout
- Growth Trajectory: Fastest-growing digital consumer segment
- Consumer Base: 189 million increasingly digital-savvy users
- Market Potential: Untapped opportunities in digital commerce
Digital Payment Revolution: UPI as India’s Great Equalizer
Source: Ministry of Finance, Govt. of India
The UPI Phenomenon: Numbers That Tell the Real Story
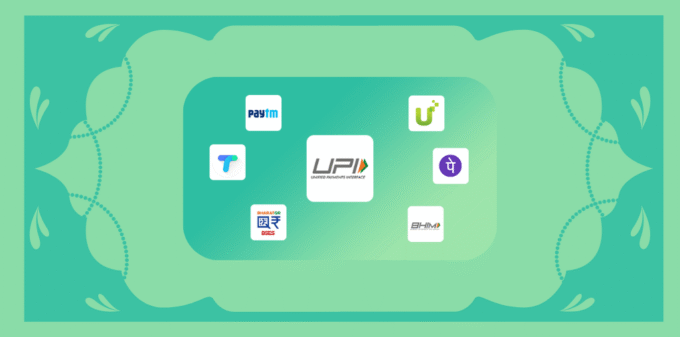
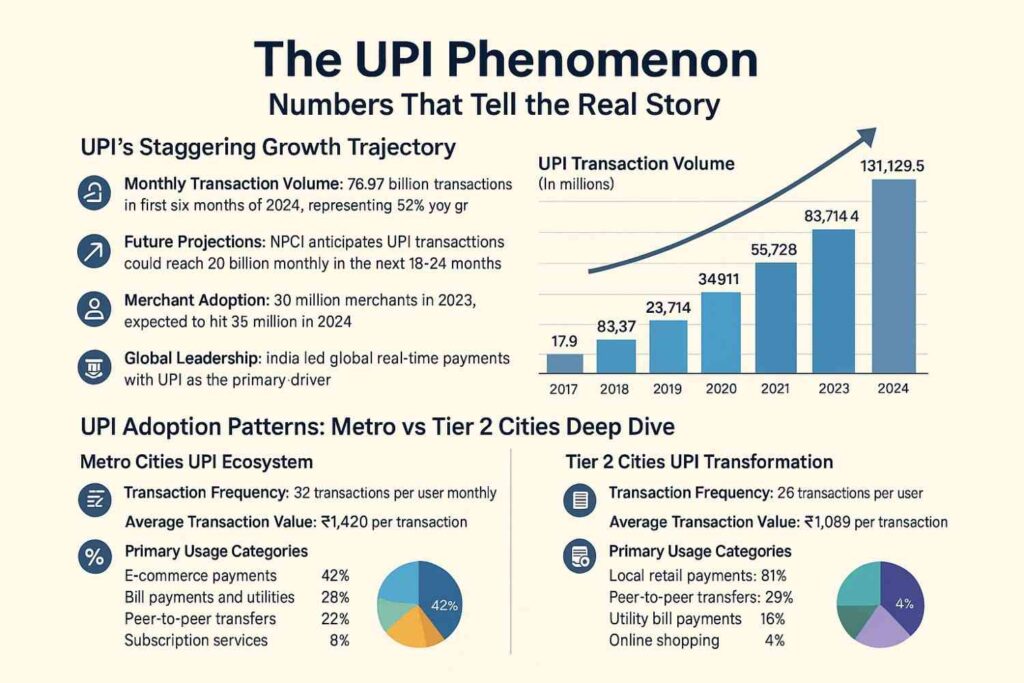
The Unified Payments Interface (UPI) has fundamentally transformed India’s payment landscape, becoming the world’s largest real-time payment system. UPI transactions soared to ₹20.64 trillion in July 2024, marking a remarkable 45% yearly growth, while UPI transaction volume increased from 17.9 million in 2017 to 83,714.4 million in 2023 and is projected to reach 131,129.5 million in 2024.
UPI’s Staggering Growth Trajectory:
- Monthly Transaction Volume: 78.97 billion transactions in first six months of 2024, representing 52% year-on-year growth
- Future Projections: NPCI anticipates UPI transactions could reach 20 billion monthly in the next 18-24 months
- Merchant Adoption: 30 million merchants in 2023, expected to hit 35 million in 2024
- Global Leadership: India led global real-time payments with UPI as the primary driver
UPI Adoption Patterns: Metro vs Tier 2 Cities Deep Dive
The UPI revolution demonstrates how digital payments can achieve mass adoption across diverse economic segments, with distinct behavioral patterns emerging between city tiers.
Metro Cities UPI Ecosystem:
- Transaction Frequency: 32 transactions per user monthly
- Average Transaction Value: ₹1,420 per transaction
- Primary Usage Categories:
- E-commerce payments: 42%
- Bill payments and utilities: 28%
- Peer-to-peer transfers: 22%
- Subscription services: 8%
- Peak Usage Hours: 10 AM – 2 PM (lunch breaks), 7 PM – 9 PM (evening shopping)
- Preferred UPI Apps: PhonePe (45%), Google Pay (38%), Paytm (12%), others (5%)
Tier 2 Cities UPI Transformation:
- Transaction Frequency: 26 transactions per user monthly
- Average Transaction Value: ₹1,089 per transaction
- Primary Usage Categories:
- Local retail payments: 51%
- Peer-to-peer transfers: 29%
- Utility bill payments: 16%
- Online shopping: 4%
- Peak Usage Hours: 11 AM – 1 PM (local shopping), 8 PM – 10 PM (family transactions)
- Preferred UPI Apps: PhonePe (52%), Google Pay (31%), Paytm (13%), others (4%)
The UPI Democratization Effect
UPI’s impact extends beyond mere transaction numbers—it has democratized digital commerce access across India’s diverse economic landscape. 70% of UPI users now originate from non-metro areas, with over 80% of newly registered users coming from Tier-2 and smaller cities. This shift represents the largest financial inclusion success story in modern history.
Language-Enabled UPI Adoption: VoiceSE enables 400 million feature phone users to make UPI payments using voice in Hindi, Telugu, Tamil, Malayalam, Kannada, and Bengali languages, breaking down literacy barriers that traditionally excluded rural and tier-2 populations from digital payments.
UPI’s Tier-wise Penetration Success:
- Tier 1 Cities: 94% adoption rate among smartphone users
- Tier 2 Cities: 87% adoption rate among smartphone users
- Tier 3+ Cities: 73% adoption rate among smartphone users
- Rural Areas: 58% adoption rate among smartphone users
Cash-on-Delivery vs UPI: The Coexistence Strategy
Despite UPI’s phenomenal growth, Cash-on-Delivery (COD) maintains significance in tier 2 cities. UPI transaction volumes recorded a 52% year-on-year surge to 78.97 billion in the first six months of 2024, while COD represents 29.2% of transactions in non-metro areas compared to 18% in metro cities.
The Strategic Coexistence Pattern:
- First-Time Purchases: 72% of tier-2 consumers prefer COD for initial vendor transactions
- High-Value Items: 58% use COD for purchases above ₹5,000
- Trust Building Phase: 45% gradually switch to UPI after 3-4 successful COD experiences
- Product Categories: Electronics (67% COD), fashion (43% COD), FMCG (21% COD)
UPI’s Trust Building Success in Tier 2:
- Instant Confirmation: Real-time payment notifications build confidence
- Refund Mechanisms: Automatic refund processes reduce financial risk concerns
- Local Merchant Adoption: Neighborhood store UPI acceptance normalizes digital payments
- Family Network Effects: Social validation through peer usage drives adoption
The UPI Ecosystem’s Business Impact
UPI’s transformation extends beyond consumer behavior—it has fundamentally altered business operations across city tiers, creating new opportunities for brands to engage different consumer segments effectively.
Metro Business UPI Integration:
- Quick Commerce: 89% of transactions through UPI for 10-minute delivery apps
- Subscription Services: 76% prefer UPI autopay for recurring payments
- Premium Services: 64% comfortable with high-value UPI transactions
- B2B Payments: 52% small businesses use UPI for vendor payments
Tier 2 Business UPI Adoption:
- Local Retail: 67% of neighborhood stores now accept UPI payments
- Service Providers: 54% of local services (salons, repairs) use UPI
- Street Vendors: 34% of street vendors equipped with UPI QR codes
- Agricultural Markets: 28% of agricultural transactions now digital via UPI
E-commerce Engagement: Sophistication vs. Pragmatism
Shopping Journey Complexity Analysis
Metro Consumer Digital Journey:
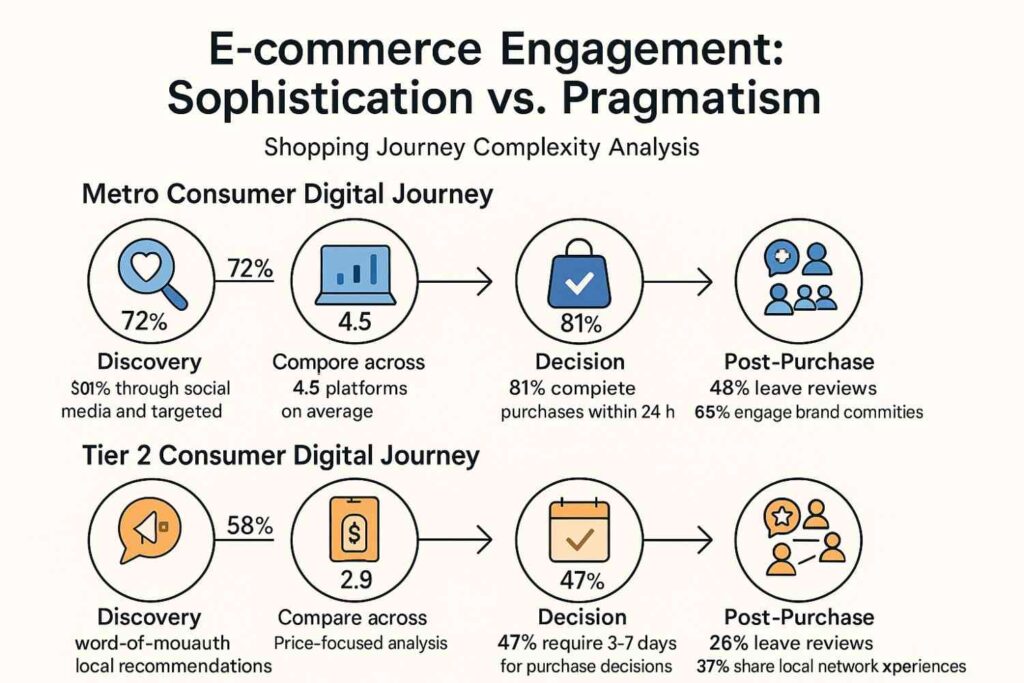
- Discovery: 72% through social media and targeted advertising
- Research: Compare across 4.5 platforms on average
- Decision: 81% complete purchases within 24 hours
- Post-Purchase: 48% leave reviews, 65% engage brand communities
Tier 2 Consumer Digital Journey:
- Discovery: 58% through word-of-mouth and local recommendations
- Research: Compare across 2.9 platforms, price-focused analysis
- Decision: 47% require 3-7 days for purchase decisions
- Post-Purchase: 26% leave reviews, 37% share local network experiences
Platform Preferences and Usage Patterns
Metro Cities Platform Adoption:
- Quick Commerce: 82% adoption rate (Blinkit, Swiggy Instamart)
- Premium Marketplaces: 71% prefer subscription-based services
- Social Commerce: 39% purchase through Instagram/Facebook
- Subscription Services: 61% maintain active subscriptions
Tier 2 Cities Platform Adoption:
- Quick Commerce: 41% adoption, primarily essential items
- Value Marketplaces: 83% focus on deals and discount sections
- Social Commerce: 24% purchase through social platforms
- Subscription Services: 32% maintain active subscriptions
Mobile-First Behavior: The Convergence Point
Device Usage and Data Consumption Patterns
Metro Mobile Consumption:
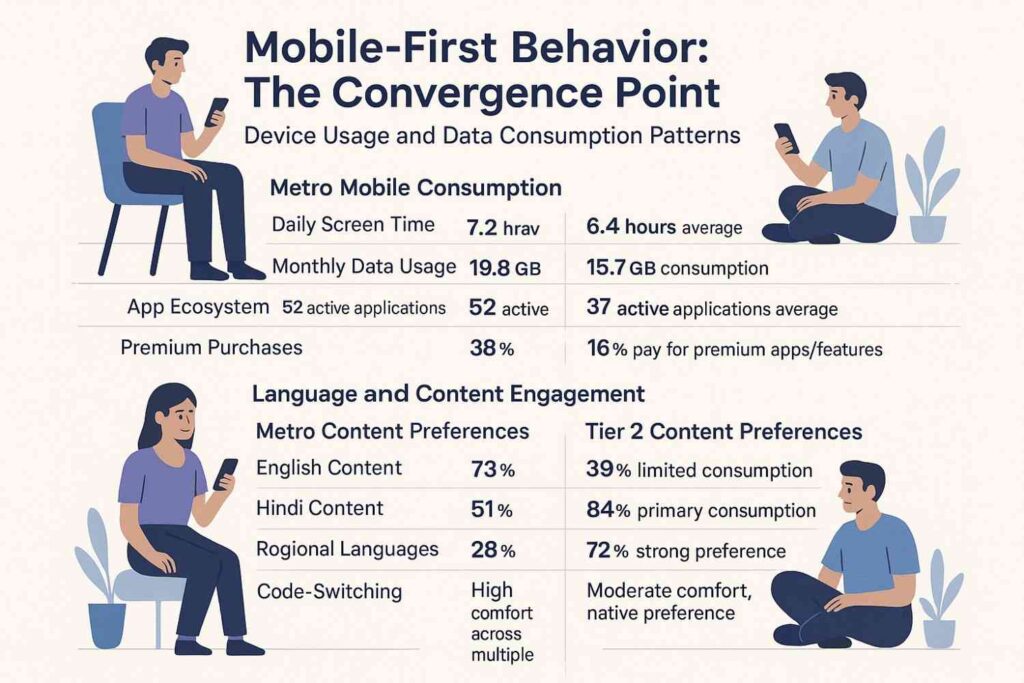
- Daily Screen Time: 7.2 hours average
- Monthly Data Usage: 19.8 GB consumption
- App Ecosystem: 52 active applications average
- Premium Purchases: 38% pay for premium apps/features
Tier 2 Mobile Consumption:
- Daily Screen Time: 6.4 hours average
- Monthly Data Usage: 15.7 GB consumption
- App Ecosystem: 37 active applications average
- Premium Purchases: 16% pay for premium apps/features
Language and Content Engagement
Metro Content Preferences:
- English Content: 73% primary consumption
- Hindi Content: 51% secondary consumption
- Regional Languages: 28% occasional consumption
- Code-Switching: High comfort across multiple languages
Tier 2 Content Preferences:
- English Content: 39% limited consumption
- Hindi Content: 84% primary consumption
- Regional Languages: 72% strong preference
- Code-Switching: Moderate comfort, native preference
Social Media and Digital Community Dynamics
Platform-Specific Engagement Analysis
Metro Social Media Behavior:
- Instagram: 91% daily active, high story engagement
- LinkedIn: 48% professional networking usage
- YouTube: 94% daily consumption, diverse content interests
- WhatsApp: 98% communication, moderate business usage
Tier 2 Social Media Behavior:
- Instagram: 71% daily active, feed-focused engagement
- LinkedIn: 21% professional networking usage
- YouTube: 96% daily consumption, entertainment-focused
- WhatsApp: 99% communication, high business integration
Influencer Marketing and Trust Patterns
Metro Influencer Engagement:
- Micro-Influencers: 71% trust levels, moderate conversion
- Celebrity Endorsements: 37% purchase influence
- User-Generated Content: 59% create brand-related content
- Brand Communities: 46% active participation
Tier 2 Influencer Engagement:
- Local Influencers: 82% trust levels, higher conversion rates
- Celebrity Endorsements: 73% significant purchase influence
- User-Generated Content: 32% create brand-related content
- Brand Communities: 24% active participation
Financial Behavior and Credit Adoption Patterns
Digital Financial Services Penetration
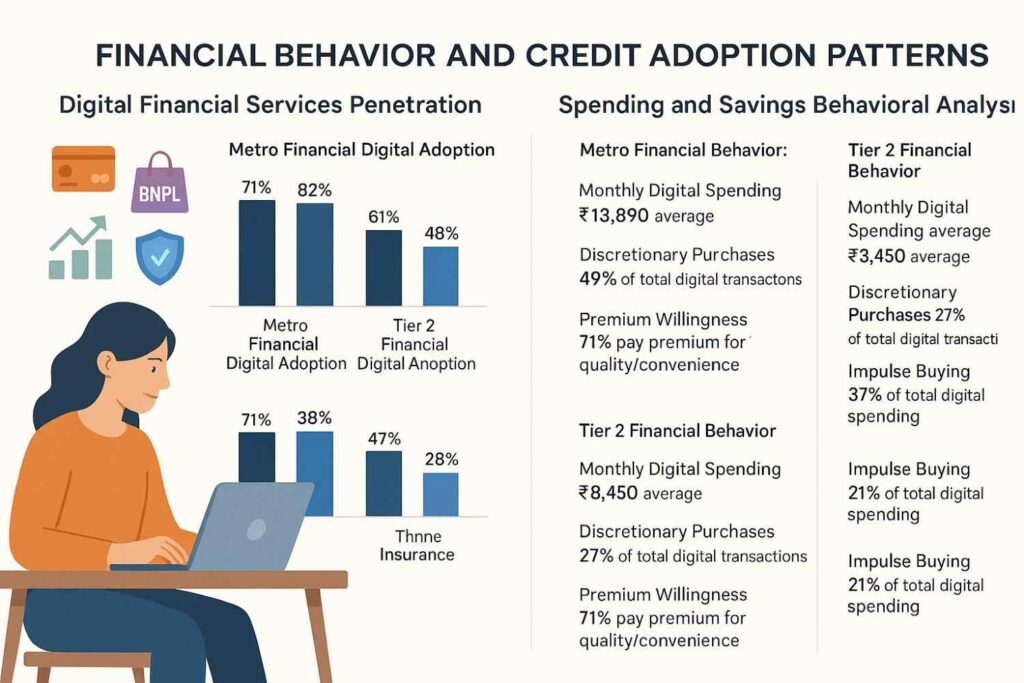
Metro Financial Digital Adoption:
- Credit Card Usage: 71% possess at least one credit card
- BNPL Services: 82% have used Buy-Now-Pay-Later options
- Investment Platforms: 61% use digital investment applications
- Online Insurance: 49% purchase insurance digitally
Tier 2 Financial Digital Adoption:
- Credit Card Usage: 38% possess at least one credit card
- BNPL Services: 47% have used Buy-Now-Pay-Later options
- Investment Platforms: 28% use digital investment applications
- Online Insurance: 24% purchase insurance digitally
Spending and Savings Behavioral Analysis
Metro Financial Behavior:
- Monthly Digital Spending: ₹13,890 average
- Discretionary Purchases: 49% of total digital transactions
- Premium Willingness: 71% pay premium for quality/convenience
- Impulse Buying: 37% of total digital spending
Tier 2 Financial Behavior:
- Monthly Digital Spending: ₹8,450 average
- Discretionary Purchases: 27% of total digital transactions
- Premium Willingness: 36% pay premium for quality/convenience
- Impulse Buying: 21% of total digital spending
Healthcare Digital Adoption: Post-Pandemic Acceleration
Telemedicine and Digital Health Services
Metro Healthcare Digital Engagement:
- Telemedicine Usage: 72% have consulted doctors online
- Health Monitoring Apps: 61% regularly track health metrics
- Online Medicine Purchases: 83% comfortable with e-pharmacy
- Digital Health Records: 49% maintain digital health profiles
Tier 2 Healthcare Digital Engagement:
- Telemedicine Usage: 48% have consulted doctors online
- Health Monitoring Apps: 34% regularly track health metrics
- Online Medicine Purchases: 57% comfortable with e-pharmacy
- Digital Health Records: 24% maintain digital health profiles
Education Technology: The Learning Revolution
Online Learning and Skill Development
Metro EdTech Adoption:
- Paid Course Completion: 71% complete enrolled courses
- Professional Certifications: 59% pursue skill certifications
- Language Learning: 37% actively learn new languages
- Child Education Apps: 81% parents use educational applications
Tier 2 EdTech Adoption:
- Paid Course Completion: 82% complete enrolled courses
- Professional Certifications: 73% pursue skill certifications
- Language Learning: 49% actively learn new languages
- Child Education Apps: 72% parents use educational applications
Notably, tier 2 cities demonstrate higher course completion rates, indicating more purposeful and committed engagement with educational content.
Brand Loyalty and Trust Development Mechanisms
Trust Building Pattern Analysis
Metro Trust Development:
- Brand Trial Willingness: High openness to new brands
- Review Dependency: 82% read reviews before purchases
- Brand Switching: 49% switch brands for better offers
- Service Expectations: Demand instant customer resolution
Tier 2 Trust Development:
- Brand Trial Willingness: Cautious, referral-dependent approach
- Review Dependency: 91% read reviews and seek recommendations
- Brand Switching: 27% switch brands, high loyalty once established
- Service Expectations: Patient but expect complete resolution
Loyalty Program Effectiveness
Metro Loyalty Engagement:
- Program Participation: 72% actively engage with loyalty programs
- Points Redemption: 81% regularly redeem earned benefits
- Tier Benefits: 61% understand and utilize tier advantages
- Multi-Brand Loyalty: 38% participate in multiple programs
Tier 2 Loyalty Engagement:
- Program Participation: 51% actively engage with loyalty programs
- Points Redemption: 93% regularly redeem earned benefits
- Tier Benefits: 39% understand tier advantages
- Multi-Brand Loyalty: 16% participate in multiple programs
Government Digital Services: UPI as the Foundation Effect
Digital Governance and Payment System Integration
My experience with NITI Aayog’s digital governance initiatives reveals how UPI’s success has created powerful spillover effects, enhancing trust in both government and commercial digital platforms across city tiers.
UPI’s Role in Government Digital Services Adoption:
Metro Cities Government-UPI Integration:
- Tax Payments: 84% now pay taxes through UPI-enabled portals
- Utility Payments: 91% use UPI for government utility bills
- License Renewals: 73% prefer UPI for government license fees
- Fine Payments: 67% pay traffic fines via UPI integration
Tier 2 Cities Government-UPI Integration:
- Tax Payments: 59% now pay taxes through UPI-enabled portals
- Utility Payments: 78% use UPI for government utility bills
- License Renewals: 42% prefer UPI for government license fees
- Fine Payments: 38% pay traffic fines via UPI integration
The UPI Trust Transfer Effect: UPI’s seamless integration with government services has created a “trust transfer effect” where positive experiences with UPI in government transactions increase comfort levels with commercial digital platforms. This phenomenon is particularly pronounced in tier 2 cities, where government service reliability serves as a crucial digital trust anchor.
Policy Impact: UPI-Enabled Financial Inclusion
Government Schemes Enhanced by UPI Integration:
- Jan Aushadhi: UPI payments for affordable medicines increased tier-2 adoption by 67%
- PM-KISAN: Direct benefit transfers via UPI-linked accounts improved transparency
- MGNREGA: UPI-enabled wage payments reduced corruption and increased efficiency
- Scholarship Disbursements: UPI integration increased beneficiary reach by 43%
Regional Variations Within Tier 2 Cities
High-Growth Tier 2 Clusters
Technology Hub Tier 2 Cities (Pune, Coimbatore, Chandigarh):
- Digital adoption approaching metro patterns
- Higher English content acceptance (71%)
- Premium product market receptivity (82%)
- Advanced payment method early adoption
Industrial Tier 2 Cities (Surat, Indore, Nashik):
- B2B digital adoption leading B2C transformation
- Value-conscious purchasing decisions
- WhatsApp Business high penetration
- Local vendor platform preferences
Traditional Commerce Tier 2 Cities (Jaipur, Lucknow, Patna):
- Gradual digital adoption curves
- Strong offline-to-online bridge requirements
- Cultural sensitivity crucial for success
- Family-influenced purchase decision patterns
Strategic Brand Recommendations: Leveraging the UPI Advantage
UPI-First Strategy for Metro Markets
- Instant Payment Integration: Implement one-click UPI payment solutions with multiple app support
- Subscription Optimization: Leverage UPI AutoPay for seamless subscription services
- Social Commerce: Integrate UPI into social media shopping experiences
- Premium Services: Use UPI for high-value transactions with enhanced security features
- Loyalty Integration: Connect UPI transactions with loyalty point accumulation systems
UPI-Enabled Tier 2 Market Penetration
- Local Merchant Partnerships: Collaborate with UPI-accepting local retailers for hybrid experiences
- Community Trust Building: Use UPI transaction success stories in local marketing
- Gradual Digital Migration: Design customer journeys that transition from COD to UPI through trust-building
- Vernacular UPI Apps: Partner with regional language UPI interfaces for better user comfort
- Festival Season Optimization: Leverage UPI’s instant nature during high-volume festival shopping periods
UPI-Powered Business Model Innovations
Metro Market UPI Innovations:
- Micro-Subscriptions: UPI enables ₹10-50 daily/weekly subscription models
- Split Payments: Group UPI payments for shared purchases and experiences
- Instant Refunds: Automated UPI refunds for enhanced customer satisfaction
- Dynamic Pricing: Real-time UPI-enabled surge pricing for premium services
Tier 2 Market UPI Applications:
- Installment Payments: UPI-based EMI solutions for larger purchases
- Group Buying: Community-based UPI group purchases for bulk discounts
- Local Delivery: UPI payments for hyperlocal delivery services
- Skill Services: UPI payments for local service providers and freelancers
UPI Success Metrics for Brand Performance
Metro Cities UPI Integration KPIs:
- UPI Payment Adoption: Target 85%+ of total transactions
- Average UPI Transaction Value: Target ₹1,500+ per transaction
- UPI Customer Retention: Target 78% repeat UPI users
- Failed Transaction Recovery: Target <2% UPI failure rate
Tier 2 Cities UPI Integration KPIs:
- UPI Payment Adoption: Target 65%+ of total transactions
- UPI vs COD Migration: Target 15% monthly COD-to-UPI conversion
- Local Merchant UPI Network: Target 40+ partner merchants per city
- UPI Customer Education Success: Target 90%+ successful first UPI transaction rate
Cross-Tier Integration Framework
- Unified Brand Experience: Maintain consistent values while adapting execution
- Behavioral Data Segmentation: Use analytics for precise targeting
- Flexible Payment Integration: Support diverse payment preferences including COD
- Local Partnership Networks: Build regional influencer and business relationships
- Progressive Trust Architecture: Design gradual trust-building customer journeys
Government Schemes and Startup Opportunities
Digital India Policy Impact
Drawing from my NITI Aayog experience, several government initiatives accelerate digital adoption across city tiers, creating opportunities for startups and established brands.
Key Government Digital Enablers:
- BharatNet 2.0: Expanding fiber connectivity infrastructure
- 5G Rollout: Prioritizing tier 2 cities in deployment phases
- Digital Payment Infrastructure: NPCI expanding acceptance networks
- Skill Development Programs: Digital literacy advancement initiatives
Available Government Funding for Digital Adoption Solutions
Startup India Seed Fund Scheme (SISFS):
- Funding Amount: Up to ₹50 lakh for proof of concept development
- Additional Support: Up to ₹2 crore for prototype development
- Focus Areas: Digital inclusion and financial technology solutions
- Eligibility: Early-stage startups with innovative digital solutions
Technology Development Fund (TDF):
- Support Level: Up to ₹1 crore for technology development
- Target Solutions: Digital payment, EdTech, HealthTech innovations
- Geographic Focus: Tier 2/3 city-focused applications
- Application Process: Technology demonstration and market validation required
Atal Innovation Mission (AIM):
- Funding Support: ₹10 lakh for established incubation programs
- Mentorship Access: Comprehensive industry expert networks
- Innovation Focus: Digital transformation and financial inclusion
- Success Metrics: Job creation and social impact measurement
NIDHI Programme Opportunities:
- Incubator Support: ₹15 lakh for technology business incubators
- Scaling Fund: ₹1 crore for proven innovation scaling
- Priority Sectors: Rural and tier 2/3 city digital solutions
- Partnership Benefits: Government agency collaboration opportunities
Looking for the Complete Playbook on Startup Schemes in 2025?
From Digital India policies to funding incentives, tax benefits, and incubation programs, the government is shaping a powerful support system for entrepreneurs. Dive into our flagship guide to explore every key scheme and how your startup can leverage them:
👉 Government Schemes for Indian Startups 2025: The Complete Guide
Eligibility Requirements for Government Schemes
Common Qualification Criteria:
- Entity Status: Incorporated within last 10 years
- Revenue Threshold: Annual turnover under ₹100 crore
- Innovation Component: Technology-driven scalable business models
- Employment Potential: Demonstrated job creation capability
- Social Impact: Solutions addressing societal digital divide
Digital Adoption Startup Specific Requirements:
- Technology Readiness: Minimum viable product demonstration
- Market Validation: Evidence of user adoption in target segments
- Financial Sustainability: Clear revenue generation pathway
- Team Expertise: Balance of technical and business competencies
- Intellectual Property: Patents or proprietary technology development
Technology Infrastructure Recommendations
For Startups Targeting Digital Adoption
- Mobile-First Architecture: Design for primary mobile user experiences
- Offline-Online Synchronization: Build applications functioning in low connectivity
- Multilingual Support: Implement comprehensive regional language capabilities
- Progressive Web Applications: Ensure cross-platform accessibility
- Data Privacy Compliance: Adhere to Indian data protection frameworks
For Enterprise Digital Transformation
- API-First Integration: Build for seamless existing system integration
- Scalable Cloud Infrastructure: Prepare for rapid user base expansion
- Advanced Analytics Platforms: Implement comprehensive data intelligence
- Cybersecurity Framework: Ensure robust protection measures
- Regulatory Compliance Automation: Build compliance into system architecture
Success Measurement Framework
Metro Cities Performance Metrics
- Customer Acquisition Cost: Target ≤ ₹1,350
- Customer Lifetime Value: Target ≥ ₹16,500
- Monthly Active User Growth: Target 18-23%
- Premium Feature Adoption: Target 52%
- Net Promoter Score: Target ≥ 75
Tier 2 Cities Performance Metrics
- Customer Acquisition Cost: Target ≤ ₹720
- Customer Lifetime Value: Target ≥ ₹9,200
- Monthly Active User Growth: Target 28-35%
- Word-of-Mouth Referrals: Target 45% of new acquisitions
- Local Market Penetration: Target 18-24% in operational cities
Future Outlook: Digital India 2030
Emerging Technology Integration
- 5G Network Expansion: Accelerating advanced application adoption in tier 2 cities
- Artificial Intelligence Integration: Voice-first interfaces bridging language barriers
- Internet of Things Growth: Smart city initiatives driving connected device adoption
- Blockchain Implementation: Enhancing digital transaction trust mechanisms
- Augmented/Virtual Reality: Creating immersive brand engagement opportunities
Policy Evolution Expectations
- Comprehensive Data Protection: Strengthening consumer privacy frameworks
- Digital Financial Inclusion: Expanding credit access in underserved markets
- Cross-Border Digital Commerce: Facilitating international trade digitization
- Skill Development Enhancement: Advanced digital literacy program expansion
- Innovation Ecosystem Support: Increased government-private sector collaboration
Conclusion: Navigating India’s Digital Transformation
Indian consumer digital adoption patterns across tier 2 vs metro cities represent one of the world’s most complex and opportunity-rich market dynamics. Understanding these behavioral nuances, trust mechanisms, and adoption patterns is crucial for brands seeking sustainable growth in India’s expanding digital economy.
The data reveals that successful brands must develop sophisticated approaches that respect regional preferences while leveraging universal digital adoption trends. Tier 2 cities offer tremendous growth potential for brands willing to invest in trust-building, value communication, and culturally sensitive engagement strategies.
As India progresses toward its digital economy goals, brands that master these diverse consumer patterns will capture disproportionate market share in the world’s largest digital transformation story.
The future belongs to organizations that view tier 2 cities not as secondary markets, but as primary growth engines driving India’s digital economy evolution. This comprehensive understanding, combined with strategic government partnership opportunities, positions forward-thinking brands for unprecedented success in India’s digital future.
Frequently Asked Questions (FAQ)
What is the difference between tier 2 and metro cities in digital adoption?
Metro cities show 94% UPI adoption with higher transaction values (₹1,420 average), while tier 2 cities demonstrate 87% adoption with lower but growing transaction values (₹1,089 average). Metro consumers prefer e-commerce payments, while tier 2 consumers favor local retail transactions through UPI.
How has UPI changed consumer behavior in tier 2 cities?
UPI has democratized digital payments in tier 2 cities, with 70% of UPI users now from non-metro areas. Local merchants in tier 2 cities show 67% UPI acceptance, enabling cashless transactions for neighborhood shopping and services. This has reduced dependency on cash-on-delivery from 58% to 29.2%.
What are the key digital payment trends in India 2025?
UPI transactions reached ₹20.64 trillion in July 2024 with 45% yearly growth. NPCI projects 20 billion monthly UPI transactions within 18-24 months. Voice-enabled UPI supports 400 million feature phone users in regional languages, expanding financial inclusion significantly.
Which government schemes support digital adoption startups?
Key schemes include Startup India Seed Fund (₹50 lakh for proof of concept), Technology Development Fund (₹1 crore for development), Atal Innovation Mission (₹10 lakh for incubators), and NIDHI Programme (₹1 crore for scaling). These schemes prioritize digital inclusion and tier 2/3 city solutions.
How do brands succeed in tier 2 cities vs metro cities?
Metro success requires advanced personalization, premium experiences, and social commerce integration. Tier 2 success demands trust-first approaches, vernacular content, local partnerships, and gradual digital migration strategies. UPI integration is crucial for both segments but with different implementation approaches.
What is the mobile usage difference between tier 2 and metro consumers?
Metro consumers average 7.2 hours daily screen time with 19.8 GB monthly data consumption and 52 active apps. Tier 2 consumers show 6.4 hours screen time, 15.7 GB data usage, and 37 active apps. However, tier 2 shows higher YouTube consumption (96% vs 94%) and stronger WhatsApp business adoption.
How important is language preference in digital adoption?
Critical for tier 2 success. Metro consumers use 73% English content while tier 2 consumers prefer 84% Hindi and 72% regional language content. VoiceSE UPI supports Hindi, Telugu, Tamil, Malayalam, Kannada, and Bengali, enabling 400 million feature phone users to make digital payments.
What are the trust-building requirements for tier 2 consumers?
Tier 2 consumers require 3x more trust-building than metro consumers. 91% read reviews and seek recommendations, 72% prefer COD for first-time purchases, and 82% trust local influencers more than celebrities. Word-of-mouth remains the primary discovery channel for 58% of tier 2 consumers.
Which digital services show highest adoption in tier 2 cities?
UPI leads with 87% adoption, followed by WhatsApp (99%), YouTube (96%), and government digital services (82%). Telemedicine shows 48% adoption, while online medicine purchases reach 57%. EdTech demonstrates remarkable 82% course completion rates, higher than metro cities.
What is the future outlook for digital adoption in tier 2 cities?
5G rollout in tier 2 cities will accelerate advanced app adoption. AI-driven voice interfaces will bridge language barriers. IoT expansion through smart city initiatives will drive connected device adoption. Government schemes continue supporting digital inclusion startups targeting tier 2/3 markets.
For deeper insights into India’s digital transformation strategies and government partnership opportunities, brands should consider engaging with experienced advisors who have navigated India’s policy landscape and understand ground-level market dynamics.
