Table Of Content
- The ₹6.2 Trillion Digital Commerce Revolution
- Current State of Indian E-commerce: By the Numbers
- Market Size and Growth Trajectory
- Platform Market Share Analysis
- Consumer Demographics
- FMCG E-commerce: The $15.8 Billion Opportunity
- Shopper Penetration Analysis: Who’s Buying Online
- The 500 Million Shopper Journey
- Purchase Decision Drivers: What Makes Indians Buy Online
- Barriers to E-commerce Adoption: The Remaining Challenges
- Regional E-commerce Landscape: State-by-State Analysis
- Top Performing States
- High-Growth Emerging Markets
- The Omnichannel Reality: Kirana to Marketplace Integration
- Mobile Commerce: The 96% Mobile-First Market
- Payment Revolution: UPI’s Continued Dominance
- Consumer Behavior: Post-Pandemic Permanence
- Strategic Recommendations for FMCG Manufacturers
- Channel Strategy Framework
- Regional Market Entry Strategy
- Technology Implementation Roadmap
- Investment and ROI Framework
- Frequently Asked Questions (FAQ)
- Market Overview
- FMCG E-commerce
- Consumer Behavior
- Technology & Payments
- Business Strategy
- Conclusion: The Future is Bharat Commerce
The ₹6.2 Trillion Digital Commerce Revolution
When I started mentoring startups through NITI Aayog’s program in 2019, Indian e-commerce was a $38 billion market dominated by electronics and fashion. Today, as I write this analysis of 500+ companies I’ve guided, we’re looking at a $87 billion market that’s fundamentally reshaping how 1.4 billion Indians discover, evaluate, and purchase products.
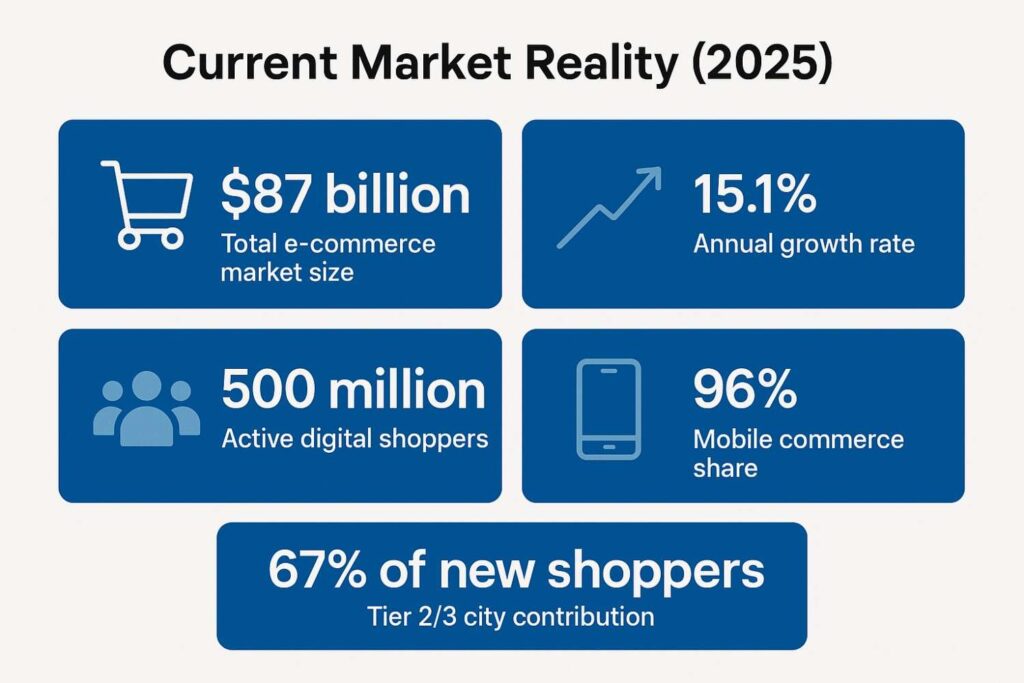
Current Market Reality (2025):
- Total e-commerce market size: $87 billion
- Annual growth rate: 15.1% CAGR
- Active digital shoppers: 500 million Indians
- Mobile commerce share: 96% of all transactions
- Tier 2/3 city contribution: 67% of new shoppers
Every day, 1.3 million Indians make their first online purchase. Every month, 37 million transactions happen in languages other than English. This transformation is creating what I call the “Bharat Commerce Layer”—a digital infrastructure enabling the next 500 million Indians to participate in modern commerce for the first time.
From my work with the government’s digital transformation initiatives, I can tell you that India’s e-commerce growth isn’t just market expansion—it’s economic democratization. We’re witnessing the largest shift in purchasing power distribution since independence.
Current State of Indian E-commerce: By the Numbers
Market Size and Growth Trajectory
2025 Market Snapshot:
- Total Gross Merchandise Value (GMV): $87.2 billion
- Year-on-Year Growth: 15.1%
- Number of transactions: 9.8 billion annually
- Average order value: ₹1,045 (up from ₹924 in 2024)
- Customer acquisition cost: ₹78 (down from ₹89 in 2024)
Platform Market Share Analysis
Marketplace Dominance:
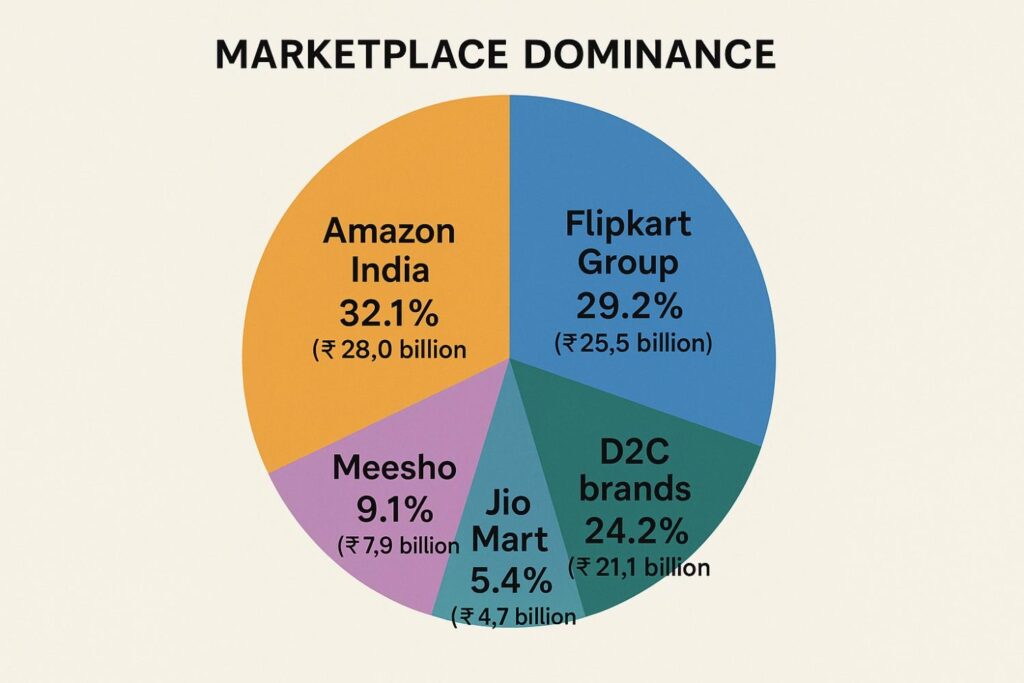
- Amazon India: 32.1% market share (₹28.0 billion GMV)
- Flipkart Group: 29.2% market share (₹25.5 billion GMV)
- Meesho: 9.1% market share (₹7.9 billion GMV)
- JioMart: 5.4% market share (₹4.7 billion GMV)
- D2C brands: 24.2% market share (₹21.1 billion GMV)
The D2C Revolution:
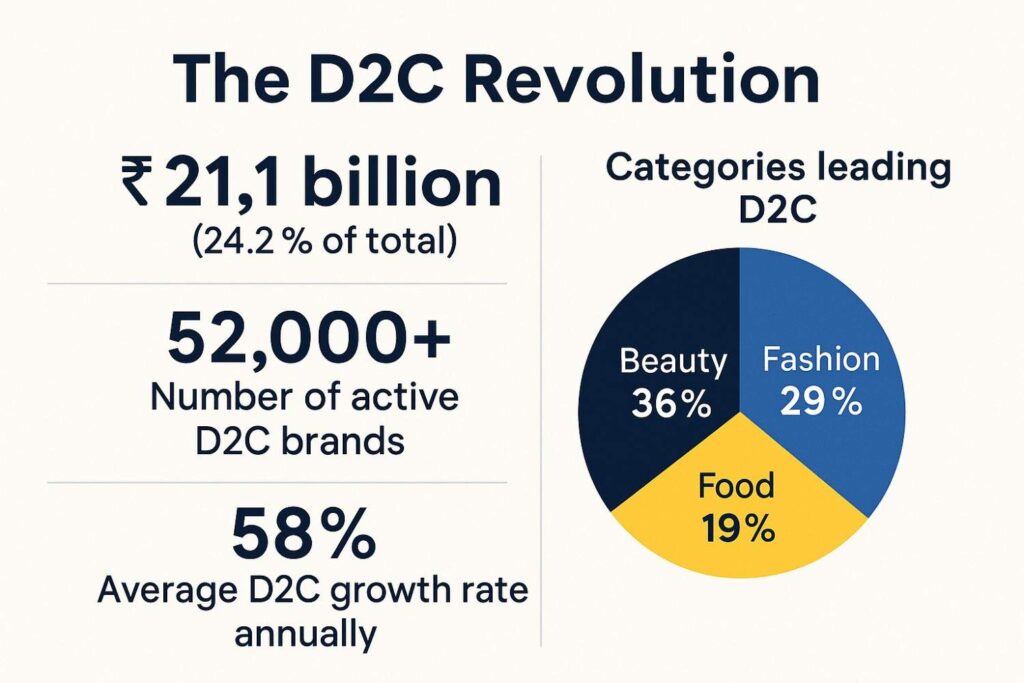
- Total D2C market size: ₹21.1 billion (24.2% of total)
- Number of active D2C brands: 52,000+
- Average D2C growth rate: 58% annually
- Categories leading D2C: Beauty (36%), Fashion (29%), Food (19%)
Consumer Demographics
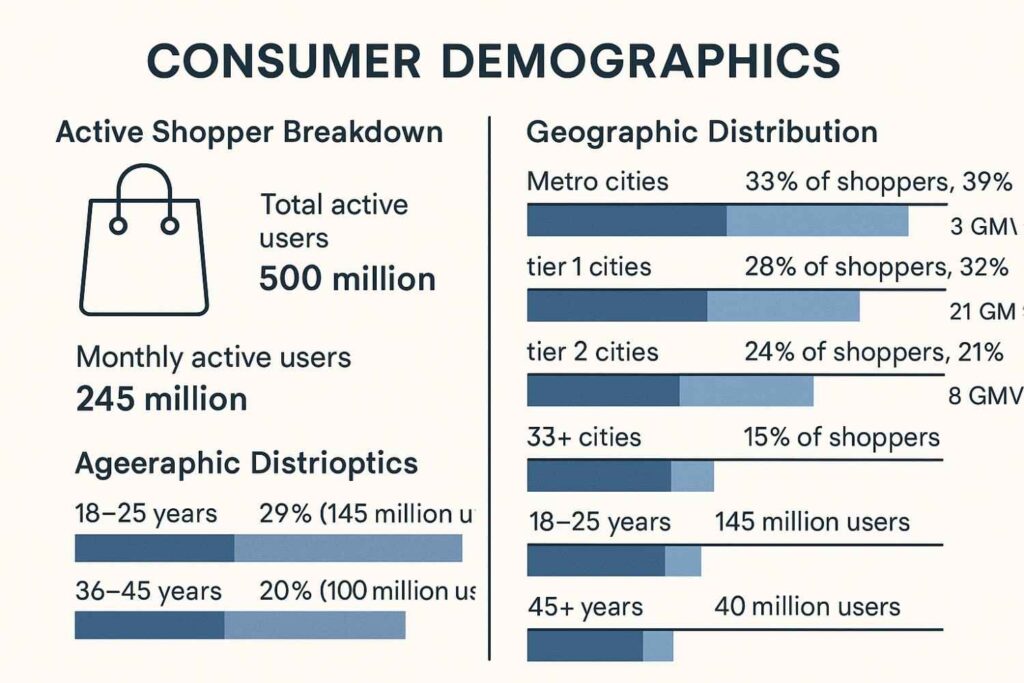
Active Shopper Breakdown:
- Total active users: 500 million
- Monthly active users: 245 million
- Geographic Distribution:
- Metro cities: 33% of shoppers, 39% of GMV
- Tier 1 cities: 28% of shoppers, 32% of GMV
- Tier 2 cities: 24% of shoppers, 21% of GMV
- Tier 3+ cities: 15% of shoppers, 8% of GMV
Age Demographics:
- 18-25 years: 29% of shoppers (145 million users)
- 26-35 years: 43% of shoppers (215 million users)
- 36-45 years: 20% of shoppers (100 million users)
- 45+ years: 8% of shoppers (40 million users)
FMCG E-commerce: The $15.8 Billion Opportunity
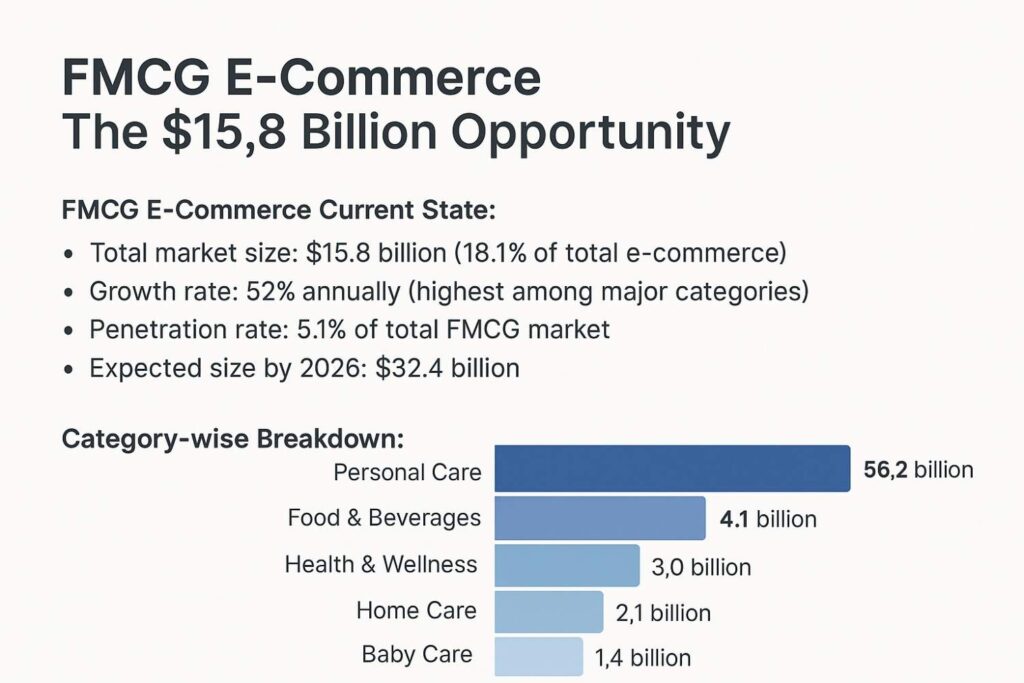
FMCG E-commerce Current State:
- Total market size: $15.8 billion (18.1% of total e-commerce)
- Growth rate: 52% annually (highest among major categories)
- Penetration rate: 5.1% of total FMCG market
- Expected size by 2026: $32.4 billion
Category-wise Breakdown:
- Personal Care: $5.2 billion (33% of FMCG e-commerce)
- Food & Beverages: $4.1 billion (26%)
- Health & Wellness: $3.0 billion (19%)
- Home Care: $2.1 billion (13%)
- Baby Care: $1.4 billion (9%)
Platform Performance in FMCG:
- Amazon Pantry/Fresh: 29.2%
- JioMart: 21.4%
- Flipkart Grocery: 19.8%
- BigBasket: 13.1%
- Quick Commerce (Zepto/Dunzo): 11.3%
- D2C Brands: 5.2%
Quick Commerce Explosion:
- Market size: $1.96 billion
- Growth rate: 145% annually
- Average delivery time: 18 minutes
- Key cities: 67 cities (up from 12 in 2023)
- AOV: ₹534 (higher than traditional grocery)
Shopper Penetration Analysis: Who’s Buying Online
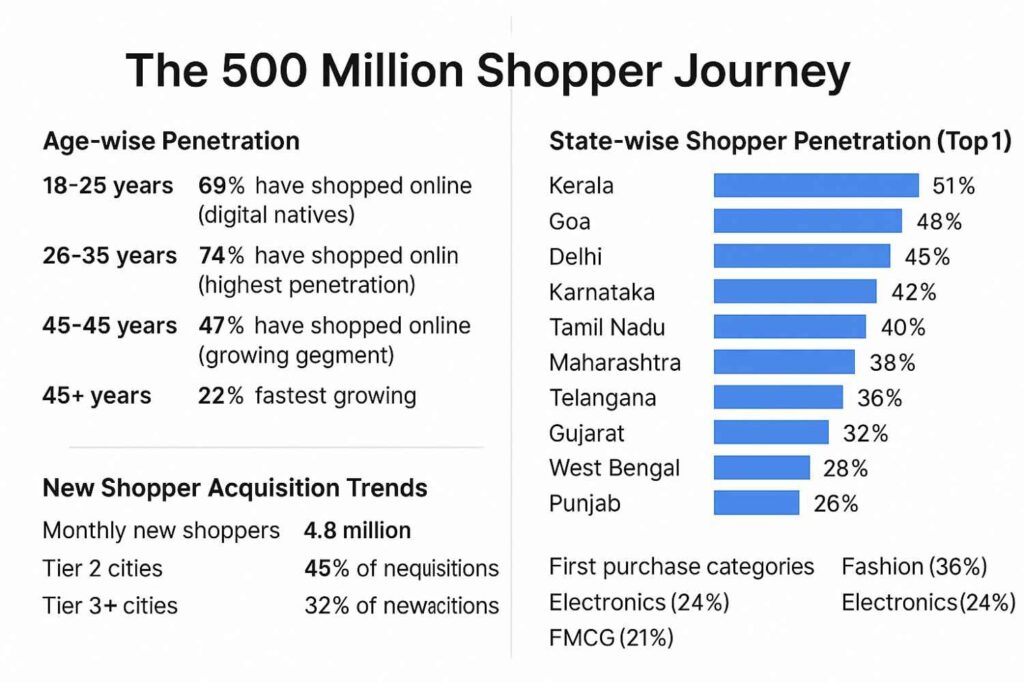
The 500 Million Shopper Journey
Age-wise Penetration:
- 18-25 years: 69% have shopped online (digital natives)
- 26-35 years: 74% have shopped online (highest penetration)
- 36-45 years: 47% have shopped online (growing segment)
- 45+ years: 22% have shopped online (fastest growing)
State-wise Shopper Penetration (Top 10):
- Kerala: 51% population shops online
- Goa: 48% population shops online
- Delhi: 45% population shops online
- Karnataka: 42% population shops online
- Tamil Nadu: 40% population shops online
- Maharashtra: 38% population shops online
- Telangana: 36% population shops online
- Gujarat: 32% population shops online
- West Bengal: 28% population shops online
- Punjab: 26% population shops online
New Shopper Acquisition Trends:
- Monthly new shoppers: 4.8 million
- Tier 2 cities: 45% of new acquisitions
- Tier 3+ cities: 32% of new acquisitions
- First purchase categories: Fashion (36%), Electronics (24%), FMCG (21%)
Purchase Decision Drivers: What Makes Indians Buy Online
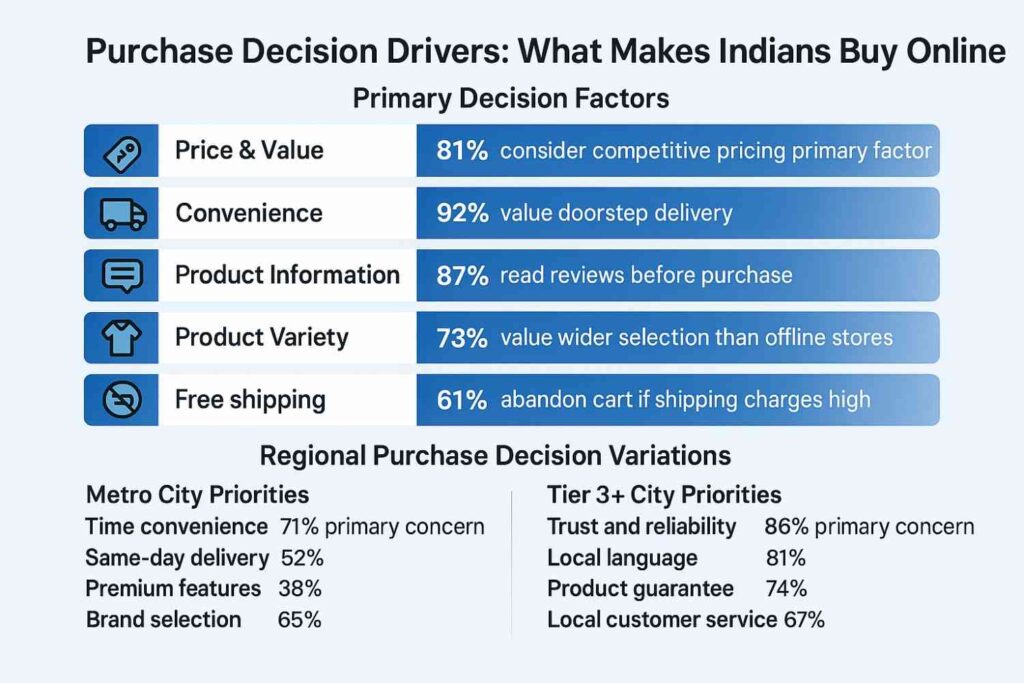
Primary Decision Factors:
- Price & Value: 81% consider competitive pricing primary factor
- Convenience: 92% value doorstep delivery
- Product Information: 87% read reviews before purchase
- Product Variety: 73% value wider selection than offline stores
- Free shipping: 61% abandon cart if shipping charges high
Regional Purchase Decision Variations:
Metro City Priorities:
- Time convenience (71% primary concern)
- Same-day delivery (52%)
- Premium features (38%)
- Brand selection (65%)
Tier 2 City Priorities:
- Price competitiveness (82% primary concern)
- Product authenticity (76%)
- Local language support (71%)
- Cash on delivery (59%)
Tier 3+ City Priorities:
- Trust and reliability (86% primary concern)
- Local language (81%)
- Product guarantee (74%)
- Local customer service (67%)
Barriers to E-commerce Adoption: The Remaining Challenges
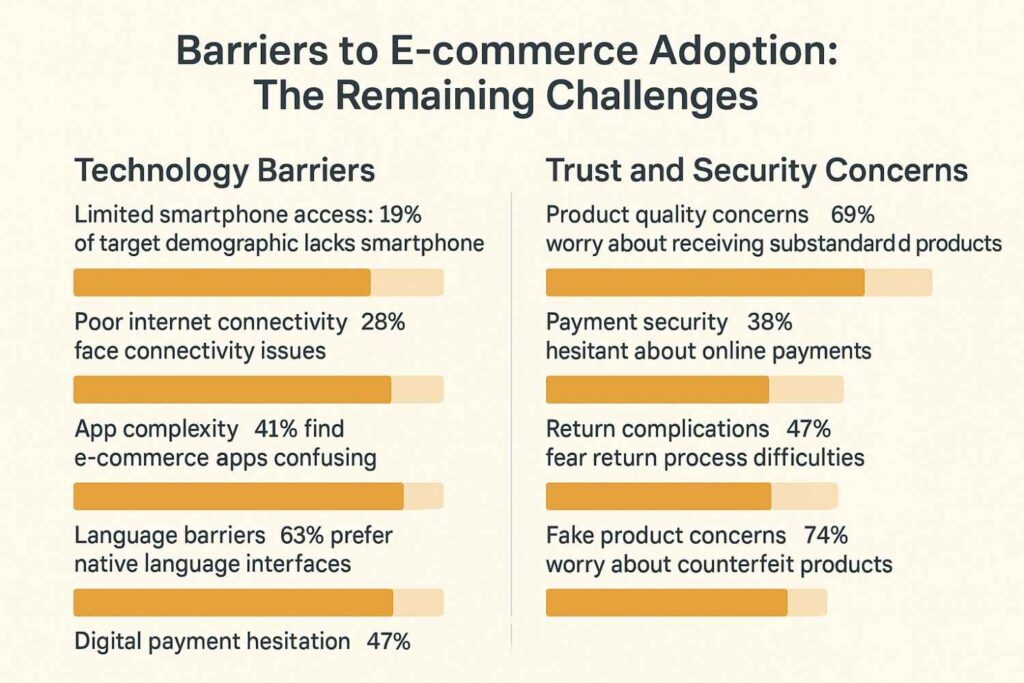
Technology Barriers:
- Limited smartphone access: 19% of target demographic lacks smartphone
- Poor internet connectivity: 28% face connectivity issues
- App complexity: 41% find e-commerce apps confusing
- Language barriers: 63% prefer native language interfaces
- Digital payment hesitation: 47% prefer cash transactions
Trust and Security Concerns:
- Product quality concerns: 69% worry about receiving substandard products
- Payment security: 38% hesitant about online payments
- Return complications: 47% fear return process difficulties
- Fake product concerns: 74% worry about counterfeit products
Economic and Cultural Barriers:
- Delivery charges: 63% abandon cart due to high delivery fees
- Touch-and-feel preference: 76% want to physically examine products
- Immediate gratification: 52% want products immediately
- Local retailer relationships: 44% prefer supporting local businesses
Regional E-commerce Landscape: State-by-State Analysis
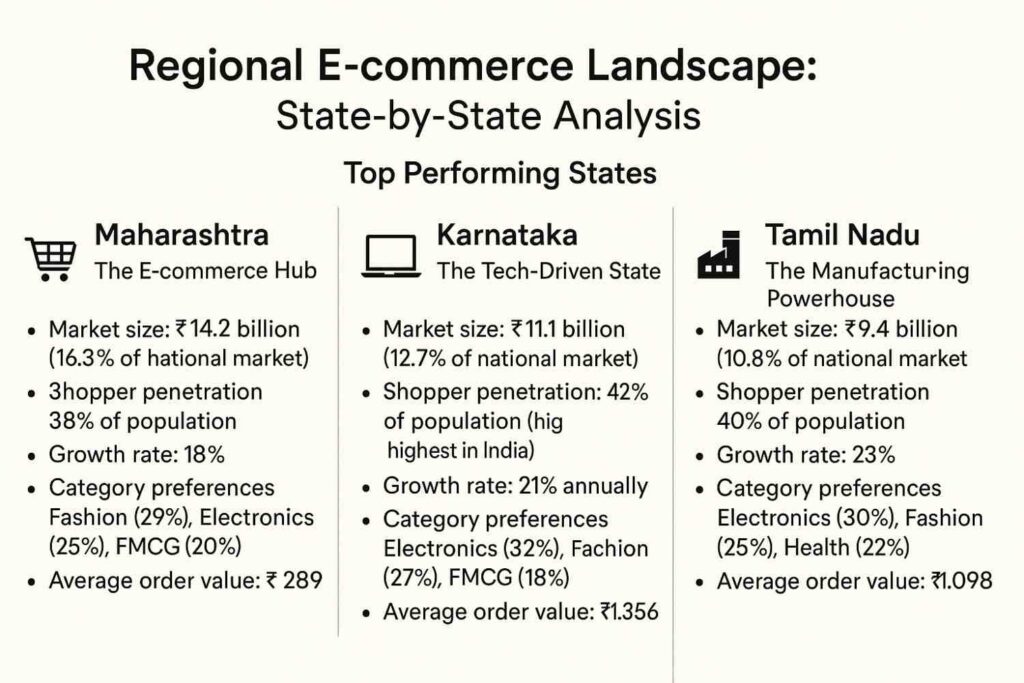
Top Performing States
Maharashtra: The E-commerce Hub
- Market size: ₹14.2 billion (16.3% of national market)
- Shopper penetration: 38% of population
- Growth rate: 18% annually
- Category preferences: Fashion (29%), Electronics (25%), FMCG (20%)
- Average order value: ₹1,289
Karnataka: The Tech-Driven State
- Market size: ₹11.1 billion (12.7% of national market)
- Shopper penetration: 42% of population (highest in India)
- Growth rate: 21% annually
- Category preferences: Electronics (32%), Fashion (27%), FMCG (18%)
- Average order value: ₹1,356
Tamil Nadu: The Manufacturing Powerhouse
- Market size: ₹9.4 billion (10.8% of national market)
- Shopper penetration: 40% of population
- Growth rate: 23% annually
- Category preferences: Electronics (30%), Fashion (25%), Health (22%)
- Average order value: ₹1,098
High-Growth Emerging Markets
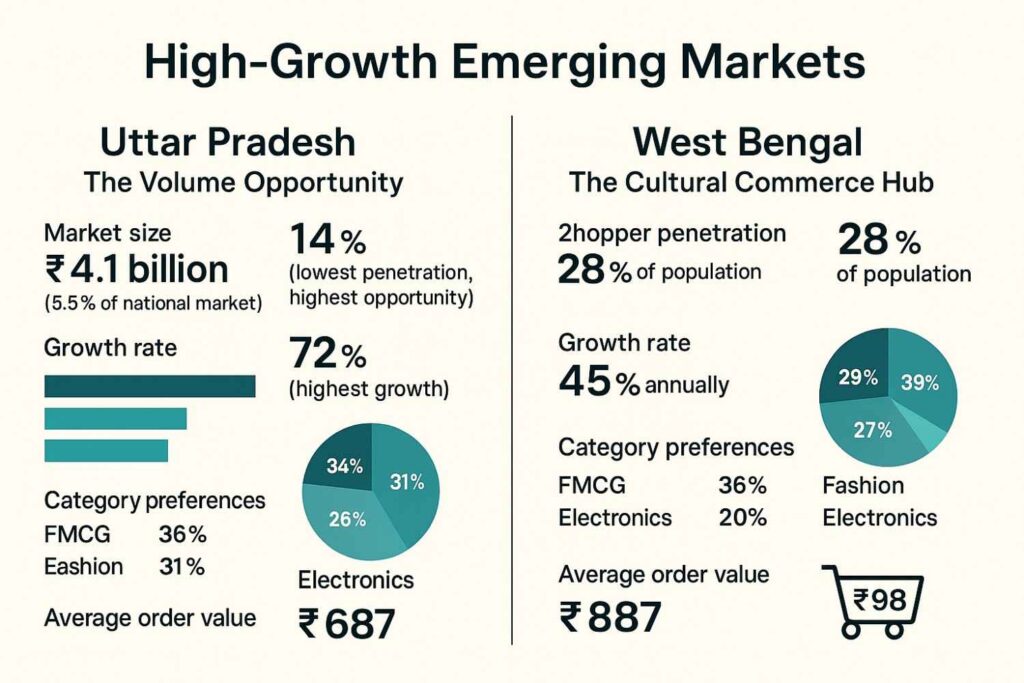
Uttar Pradesh: The Volume Opportunity
- Market size: ₹4.1 billion (4.7% of national market)
- Shopper penetration: 14% of population (lowest penetration, highest opportunity)
- Growth rate: 72% annually (highest growth)
- Category preferences: FMCG (36%), Fashion (31%), Electronics (20%)
- Average order value: ₹687
West Bengal: The Cultural Commerce Hub
- Market size: ₹4.8 billion (5.5% of national market)
- Shopper penetration: 28% of population
- Growth rate: 45% annually
- Category preferences: Books (29%), Fashion (27%), FMCG (24%)
- Average order value: ₹798
The Omnichannel Reality: Kirana to Marketplace Integration
Kirana Digital Transformation:
- Total kirana stores: 12.5 million across India
- Digital adoption: 34% have some digital presence (up from 23% in 2024)
- Revenue size: ₹485,000 crore annually (62% of retail)
Digital Integration Models:
- JioMart Partner model: 300,000+ kiranas enrolled
- Amazon Local Shops: 65,000+ kiranas connected
- Flipkart Nearby: 38,000+ kirana partnerships
- Revenue increase: 45% average increase for digitally integrated kiranas
- Customer satisfaction: 4.7/5 (vs 4.3/5 for traditional delivery)
Mobile Commerce: The 96% Mobile-First Market
Mobile Transaction Statistics:
- Mobile share of e-commerce: 96% of all transactions (up from 94% in 2024)
- Mobile GMV: ₹83.7 billion (96% of total ₹87.2 billion)
- Average mobile session duration: 9.1 minutes
- Mobile conversion rate: 2.4% (vs 3.7% desktop)
- 5G users: 34% of mobile commerce users (up from 12% in 2024)
Device and OS Distribution:
- Android dominance: 87% of mobile commerce
- iOS share: 13% of mobile commerce (but 38% of high-value transactions)
- Average device price: ₹14,200 for e-commerce users
Regional Mobile Commerce Variations:
- Metro Cities: Premium app usage (71%), AR features (24%), voice search (28%)
- Tier 2 Cities: Regional language apps (58%), WhatsApp commerce (72%)
- Tier 3+ Cities: Simple interfaces (92%), native language support (96%)
Payment Revolution: UPI’s Continued Dominance
UPI Transaction Statistics:
- Monthly UPI transactions: 16.8 billion (August 2025)
- Monthly UPI value: ₹28.45 lakh crore
- E-commerce UPI share: 72% of all online transactions
- Transaction success rate: 98.3% (improved from 97.8% in 2024)
Payment Method Distribution:
- UPI: 72% of transactions, 48% of value
- Credit Cards: 9% of transactions, 28% of value
- Debit Cards: 10% of transactions, 13% of value
- Digital Wallets: 4% of transactions, 4% of value
- BNPL: 3% of transactions, 6% of value
- Cash on Delivery: 2% of transactions, 1% of value
UPI Impact on Growth:
- New user acquisition: 52% of new e-commerce users cite easy payments
- Transaction frequency: 38% increase in purchase frequency post-UPI
- Cart abandonment: 71% reduction in payment-related cart abandonment
- Rural penetration: 91% of rural e-commerce growth linked to UPI
The payment infrastructure transformation has been remarkable, with UPI processing 72% of all e-commerce transactions. However, choosing the right payment gateway remains crucial for FMCG brands entering digital commerce. For detailed insights on optimizing payment costs and compliance, especially for Tier 2/3 market expansion, check out our comprehensive guide on Best Payment Gateways in India 2025: Fee Hacks, Compliance Secrets & Tier 2/3 Tactics where we share 11 years of founder experience in payment optimization.
Consumer Behavior: Post-Pandemic Permanence
Behavioral Permanence:
- Shopping frequency: 9.2 purchases per user annually (up from 8.7 in 2024)
- Category diversity: Average user shops in 4.8 categories
- Age group expansion: 45+ group now 22% penetration (vs 18% in 2024)
New Trends in 2025:
- Voice commerce: 18% users have tried voice shopping
- Live commerce: 28% users have shopped via live streams
- Augmented reality: 14% users have used AR features
- Sustainability focus: 43% consider environmental impact
- Quick commerce: 15-minute delivery in 67 cities
Purchase Journey Evolution:
- Decision time reduction: 38% faster purchase decisions
- Impulse buying: 52% increase in unplanned purchases
- Subscription adoption: 520% growth in subscription services
- Brand experimentation: 74% more willing to try new brands
Strategic Recommendations for FMCG Manufacturers
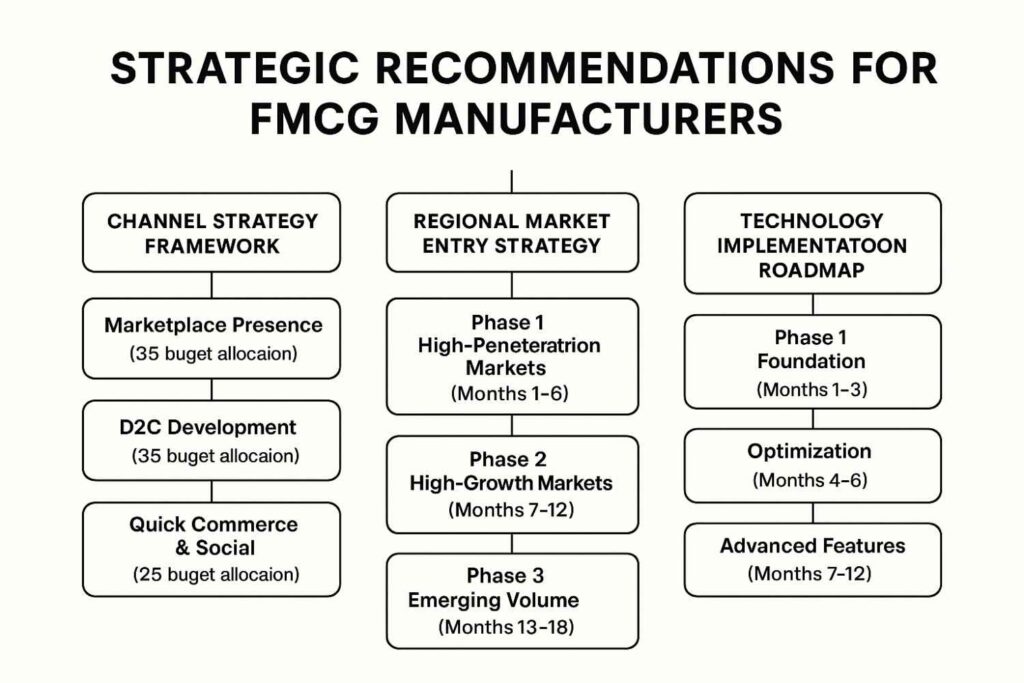
Channel Strategy Framework
Multi-Channel Portfolio Approach:
Tier 1: Marketplace Presence (40% budget allocation)
- Priority platforms: Amazon, Flipkart, JioMart for national reach
- Key objectives: Volume, visibility, customer acquisition
- Success metrics: Sales velocity, search rankings, reviews
- Timeline: 0-6 months for full deployment
Tier 2: D2C Development (35% budget allocation)
- Platform strategy: Own website + social commerce integration
- Key objectives: Brand building, customer data, premium positioning
- Success metrics: Customer lifetime value, repeat purchases, brand recall
- Timeline: 6-18 months for meaningful impact
Tier 3: Quick Commerce & Social (25% budget allocation)
- Platform focus: Zepto, WhatsApp Business, Instagram Shopping
- Key objectives: Immediate needs, community engagement, regional penetration
- Success metrics: Engagement rates, referral sales, regional growth
- Timeline: 3-12 months for community development
Regional Market Entry Strategy
Phase 1: High-Penetration Markets (Months 1-6)
- Target states: Maharashtra, Karnataka, Tamil Nadu, Delhi NCR
- Strategy: Premium positioning, wide SKU availability
- Investment: ₹60-85 lakh per state
- Expected ROI: 350-450% within 12 months
Phase 2: High-Growth Markets (Months 7-12)
- Target states: Gujarat, Telangana, West Bengal, Punjab
- Strategy: Value positioning, regional language content
- Investment: ₹35-60 lakh per state
- Expected ROI: 280-380% within 18 months
Phase 3: Emerging Volume Markets (Months 13-18)
- Target states: Uttar Pradesh, Rajasthan, Madhya Pradesh
- Strategy: Mass market pricing, kirana partnerships
- Investment: ₹25-40 lakh per state
- Expected ROI: 220-320% within 24 months
Technology Implementation Roadmap
Phase 1: Foundation (Months 1-3)
- E-commerce platform setup: Shopify/WooCommerce implementation
- Payment integration: UPI, cards, wallets, BNPL
- Mobile-first design: Responsive, fast-loading interfaces
- Analytics implementation: Google Analytics 4, Facebook Pixel
Phase 2: Optimization (Months 4-6)
- Marketing automation: Email/SMS campaigns, abandoned cart recovery
- Personalization engine: AI-powered product recommendations
- Social media integration: Instagram/Facebook shopping, WhatsApp catalog
- Voice search optimization: Regional language voice capabilities
Phase 3: Advanced Features (Months 7-12)
- AR/VR integration: Virtual try-on, product visualization
- Live commerce platform: Real-time selling capabilities
- Subscription management: Recurring orders, flexible billing
- Regional language AI: Chatbots in local languages
Investment and ROI Framework
Year 1 Investment (₹1.5-2.5 Crore Budget):
- Technology setup: 25% (₹37.5-62.5 lakh)
- Performance marketing: 35% (₹52.5-87.5 lakh)
- Content creation: 15% (₹22.5-37.5 lakh)
- Inventory/fulfillment: 20% (₹30-50 lakh)
- Team/operations: 5% (₹7.5-12.5 lakh)
Expected ROI Timeline:
- Months 1-6: Investment phase, 50-100% ROI
- Months 7-12: Growth phase, 200-350% ROI
- Year 2: Scale phase, 400-600% ROI
- Year 3+: Optimization phase, 600-900% ROI
Frequently Asked Questions (FAQ)
Market Overview
Q: How big is India’s e-commerce market in 2025? A: India’s e-commerce market reached $87 billion in 2025, with 500+ million active digital shoppers. The market is growing at 15.1% annually, with mobile commerce accounting for 96% of all transactions.
Q: Which states have the highest e-commerce penetration? A: Kerala leads with 51% penetration, followed by Goa (48%), Delhi (45%), and Karnataka (42%). However, Uttar Pradesh offers the biggest opportunity with only 14% penetration but massive population base.
Q: What’s driving the growth in Tier 2/3 cities? A: Key drivers include improved internet infrastructure (5G expansion), regional language support, UPI payment adoption, and last-mile delivery expansion. These cities contribute 67% of new shopper acquisitions and show 45-72% annual growth rates.
FMCG E-commerce
Q: How fast is FMCG e-commerce growing in India? A: FMCG e-commerce is growing at 52% annually, reaching $15.8 billion in 2025. It now represents 5.1% of the total FMCG market, with personal care leading at 33% of online FMCG sales.
Q: Which FMCG categories perform best online? A: Personal care (33%), food & beverages (26%), and health & wellness (19%) lead FMCG e-commerce. Quick commerce has particularly boosted daily essentials and grocery categories, growing 145% annually.
Q: What’s the repeat purchase rate for FMCG online? A: FMCG has the highest repeat purchase rate at 89% across all e-commerce categories, driven by convenience and subscription models. Subscription adoption has grown 520% since the pandemic.
Consumer Behavior
Q: How has the pandemic permanently changed shopping behavior? A: 78% of pandemic-era adopters continue shopping online regularly. Purchase frequency increased from 3.4 to 9.2 annually, and users now shop across 4.8 categories on average vs 1.8 pre-pandemic. The shift appears permanent.
Q: What are the main barriers to e-commerce adoption? A: Technology barriers (28% face connectivity issues), trust concerns (69% worry about product quality), and preference for physical examination (76%) remain key challenges, especially in rural areas.
Q: How important are customer reviews in purchase decisions? A: 87% of Indian consumers read reviews before purchasing, making it the most influential factor after price. Regional language reviews are particularly important in Tier 2/3 cities, where they increase conversion by 34%.
Technology & Payments
Q: How dominant is mobile commerce in India? A: Mobile accounts for 96% of all e-commerce transactions. 5G adoption among e-commerce users reached 34% in 2025, enabling richer experiences like AR try-ons (14% usage) and live commerce (28% participation).
Q: What’s the role of UPI in e-commerce growth? A: UPI processes 72% of all e-commerce transactions with a 98.3% success rate. It has been crucial in enabling rural and Tier 2/3 city adoption by removing payment barriers and reducing cart abandonment by 71%.
Q: How important is WhatsApp for commerce? A: WhatsApp Business has 12.3 million commerce-enabled accounts processing ₹2,100 crore annually. It’s particularly important in Tier 2/3 cities where 72% prefer WhatsApp shopping for trust and convenience.
Business Strategy
Q: Should FMCG brands focus on marketplaces or D2C? A: A balanced approach works best: 40% budget on marketplaces for volume and visibility, 35% on D2C for brand building and customer data, and 25% on quick commerce and social platforms for engagement and immediate needs.
Q: What’s the typical ROI timeline for FMCG e-commerce investment? A: Months 1-6 are investment phase with 50-100% ROI, months 7-12 achieve growth phase with 200-350% ROI, Year 2 delivers scale phase with 400-600% ROI, and Year 3+ optimizes to 600-900% ROI.
Q: How important is regional language support? A: 63% of Indian e-commerce users prefer native language interfaces. Brands with vernacular support see 68% higher customer retention and 340% faster adoption in regional markets. Regional language reviews increase conversion by 34%.
Q: What’s the impact of quick commerce on FMCG? A: Quick commerce (15-minute delivery) has grown to $1.96 billion market, expanding to 67 cities. It’s particularly transformative for FMCG with 145% annual growth and ₹534 average order value, changing purchase patterns for daily essentials.
Conclusion: The Future is Bharat Commerce
As we stand at the midpoint of 2025, India’s e-commerce landscape represents one of the most dynamic and transformative markets globally. The journey from a $38 billion market in 2019 to an $87 billion powerhouse today isn’t just about numbers—it’s about the democratization of commerce for 1.4 billion Indians.
The transformation we’re witnessing is unprecedented in scale and speed:
The 500 million digital shoppers aren’t just consumers; they’re active participants in a new economic paradigm where a farmer in rural Punjab can sell directly to a customer in Mumbai, where a small beauty brand can compete with multinational giants, and where a housewife in Tier 3 city can discover products that weren’t available in her local market just years ago.
Key transformation highlights:
- Geographic democratization: 67% of new shoppers come from Tier 2/3 cities
- Category explosion: From 2-3 dominant categories to 15+ thriving segments
- Language liberation: 37 million monthly transactions in regional languages
- Payment revolution: 98.3% UPI success rate enabling seamless transactions
- Infrastructure maturation: 21,000+ PIN codes with reliable delivery
For FMCG manufacturers and retailers, the opportunity is clear but complex:
The $15.8 billion FMCG e-commerce market growing at 52% annually represents just the beginning. With only 5.1% penetration of the total FMCG market, we’re looking at a potential $50+ billion opportunity by 2030. But success requires understanding that this isn’t just about putting products online—it’s about reimagining how brands connect with consumers across diverse markets, languages, and price points.
The winning strategy combines:
- Marketplace presence for reach and volume
- D2C capabilities for brand building and customer relationships
- Quick and social commerce for community engagement and immediate needs
- Regional customization for local relevance and trust
- Technology integration for seamless omnichannel experiences
Looking ahead, five trends will define the next phase:
- The Rise of Bharat: Tier 2/3 cities will drive 70%+ of growth, demanding vernacular content, local payment methods, and culturally relevant products.
- Quick Commerce Maturation: 15-minute delivery expanding beyond metros to 67 cities, fundamentally changing purchase patterns for daily essentials.
- Social Commerce Integration: WhatsApp, Instagram, and regional social platforms becoming primary discovery and purchase channels, especially for younger demographics.
- Voice and Visual Commerce: 5G enabling rich media experiences, AR try-ons (14% adoption), and voice shopping in regional languages.
- Sustainability Focus: 43% of consumers now consider environmental impact, pushing brands toward sustainable packaging and carbon-neutral delivery.
The call to action is urgent:
Every day of delay means missing out on 1.3 million new digital shoppers entering the market. Every month without a comprehensive digital strategy means competitors are building deeper relationships with your potential customers. Every quarter without regional language support means losing ground in India’s fastest-growing markets.
The companies that will win in this new Bharat Commerce era are those that understand that Indian e-commerce isn’t about replicating Western models—it’s about creating uniquely Indian solutions for uniquely Indian challenges and opportunities.
The future belongs to brands that can:
- Think globally but act locally across 28 states and 8 union territories
- Embrace the complexity of serving customers who speak 22 official languages
- Build trust in markets where relationships matter more than transactions
- Leverage technology to bridge the gap between digital and physical retail
- Create value for the entire ecosystem—from farmers to final consumers
As we move toward a $200 billion e-commerce market by 2030, the question isn’t whether your brand should be part of this transformation—it’s whether you’ll lead it or follow it.
The 500 million digital shoppers have spoken. They want convenience, variety, value, and trust. They want products that understand their culture, speak their language, and respect their preferences. They want brands that see them not as markets to capture, but as communities to serve.
The Bharat Commerce revolution is here. The only question is: Are you ready to be part of India’s digital destiny?
For more insights on navigating India’s e-commerce landscape and implementing successful digital strategies, connect with me through NITI Aayog’s Mentor for Change program or reach out directly for strategic consulting on e-commerce transformation.
