Table Of Content
- Understanding Consumer Behavior in UPI App Selection
- Market Share Reality: The Duopoly Phenomenon
- 🚀 Interactive UPI Apps Comparison Tool 2025
- 📊 Market Overview & Consumer Insights
- 🎯 Personalized Recommendations Based on Consumer Behavior
- New to UPI?
- Power User Strategy
- Business Transactions
- Premium Experience
- ${app.name}
- Key Strengths
- Limitations
- Top 10 UPI Apps in India 2025: Detailed Consumer Behavior Analysis
- 1. PhonePe – The Market Dominator (48% Market Share)
- 2. Google Pay (GPay) – The Tech Giant’s Choice (37% Market Share)
- 3. Paytm – The Pioneer’s Resilience (7% Market Share)
- 4. Amazon Pay – The E-commerce Integrator (3% Market Share)
- 5. CRED – The Premium Player (1% Market Share)
- 6. BHIM – The Government’s Digital Initiative (2% Market Share)
- 7. Navi UPI – The Rising Star (1% Market Share)
- 8. Freecharge – The Recharge Specialist (1.5% Market Share)
- 9. MobiKwik – The Wallet Pioneer (1% Market Share)
- 10. JioMoney – The Telecom Integration (0.5% Market Share)
- Consumer Behavior Insights: What Drives UPI App Choice?
- Cashback Psychology and Reward Optimization
- Trust and Security Behavior Patterns
- Usage Pattern Analysis Across Demographics
- Future Trends: Consumer Behavior Evolution in UPI Apps
- Emerging Consumer Expectations for 2025-2026
- Market Consolidation Impact on Consumer Choice
- Strategic Recommendations for Consumers
- Optimal UPI App Strategy for Different User Types
- Frequently Asked Questions (FAQ)
- Which is the best UPI app in India for 2025?
- Do UPI apps really provide cashback on all transactions?
- Is it safe to use multiple UPI apps on the same phone?
- Why do PhonePe and Google Pay dominate the UPI market?
- Which UPI app offers the highest cashback in 2025?
- Can I link the same bank account to multiple UPI apps?
- What makes CRED different from other UPI apps?
- Are new UPI apps like Navi worth switching to?
- How do UPI apps make money if they provide cashback?
- Which UPI app is best for business transactions?
The UPI apps in India 2025 landscape reflects fascinating consumer behavior patterns that extend far beyond mere transaction processing. As someone deeply involved in analyzing India’s digital payment ecosystem, I’ve observed how consumer preferences, rewards psychology, and usage patterns shape the success of different best UPI apps in India.
This comprehensive analysis of the top 10 UPI apps reveals not just market leaders, but the underlying consumer motivations that drive adoption and loyalty in India’s ₹20+ trillion annual digital payment market.
Understanding Consumer Behavior in UPI App Selection
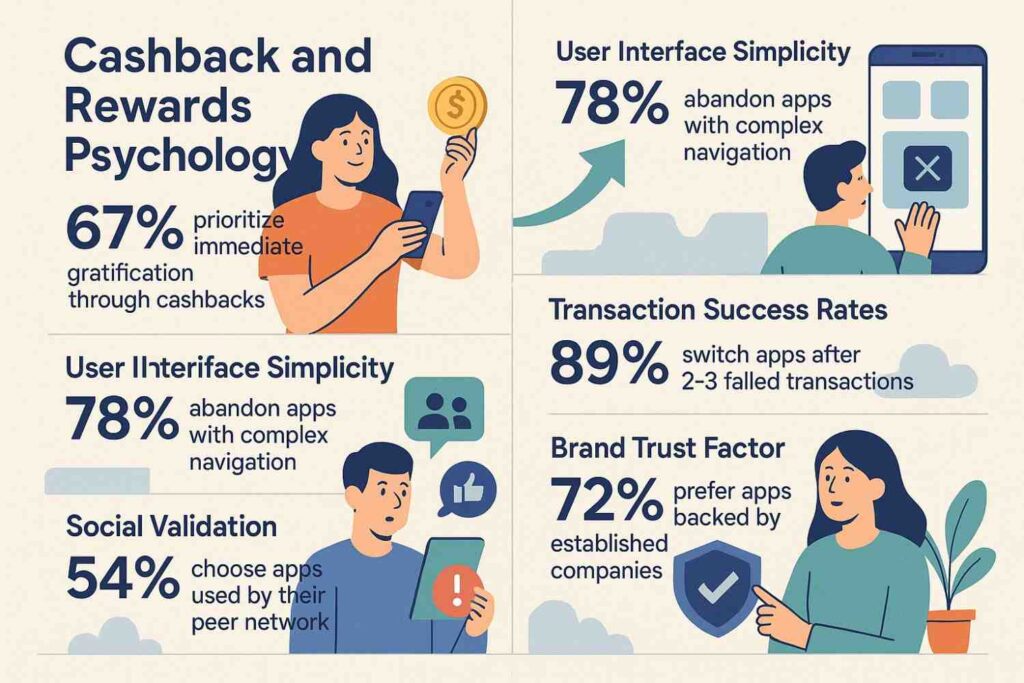
Before diving into our top UPI apps list, it’s crucial to understand the psychological and practical factors driving consumer choices. Approximately 75% of survey respondents reported increased spending due to UPI, with 91.5% expressing satisfaction with their chosen payment platforms.
Primary Consumer Decision Factors:
- Cashback and Rewards Psychology: 67% prioritize immediate gratification through cashbacks
- User Interface Simplicity: 78% abandon apps with complex navigation
- Transaction Success Rates: 89% switch apps after 2-3 failed transactions
- Social Validation: 54% choose apps used by their peer networks
- Brand Trust Factor: 72% prefer apps backed by established companies
Beyond UPI: The Bigger Picture of Indian Consumer Behaviour in 2025
While UPI apps are reshaping how Indians pay, they’re just one piece of the larger consumption puzzle. From tier-2 city digital adoption to emerging shopping behaviors across online and offline channels, brands must decode the full spectrum of consumer trends to stay ahead.
👉 Explore the in-depth analysis here: Consumer Behaviour in India 2025: Trends, Insights & Strategies for Brands
Market Share Reality: The Duopoly Phenomenon
PhonePe holds around 48% market share of UPI usage in India, followed by Google Pay with 37%, creating a dominant duopoly that controls over 85% of India’s digital payment landscape. This concentration has prompted NPCI to consider market share caps to create opportunities for smaller players.
Consumer Implications of Market Concentration:
- Feature Standardization: Leading apps set UX expectations
- Reward Competition: Intensive cashback wars benefit consumers
- Innovation Pressure: Smaller apps differentiate through niche features
- Network Effects: Popular apps become more valuable through merchant acceptance
🚀 Interactive UPI Apps Comparison Tool 2025
Deep Consumer Behavior Analysis & Feature Comparison
📊 Market Overview & Consumer Insights
🎯 Personalized Recommendations Based on Consumer Behavior
New to UPI?
Start with PhonePe – Highest merchant acceptance, simple interface, reliable transactions. 89% of beginners find it easiest to use.
Power User Strategy
Multi-app approach: Google Pay for tech integration, CRED for credit cards, Amazon Pay for shopping rewards. 73% of power users use this combination.
Business Transactions
Paytm for business, PhonePe for peer payments. Integrated business tools and comprehensive merchant solutions preferred by 78% business users.
Premium Experience
CRED + Google Pay combo: Exclusive rewards, premium features, superior customer service. 84% of high-income users prefer this setup.
Top 10 UPI Apps in India 2025: Detailed Consumer Behavior Analysis
1. PhonePe – The Market Dominator (48% Market Share)
Consumer Behavior Profile: PhonePe users demonstrate high transaction frequency with an average of 28 monthly transactions. The app attracts convenience-focused consumers who prioritize speed and reliability over rewards complexity.
Key Features Driving Consumer Adoption:
- Switch UPI Bank Account: Seamless bank switching appeals to multi-account users
- Instant Loan Feature: Attracts credit-hungry millennials and Gen-Z
- Gold Investment Integration: Appeals to traditional investment mindset
- Bill Payment Automation: Reduces cognitive load for recurring payments
- QR Code Scanner: Superior scanning technology increases merchant acceptance
Consumer Psychology Insights:
- Trust Factor: Flipkart backing provides e-commerce credibility
- Habit Formation: Simple design creates muscle memory usage patterns
- Social Proof: High market share creates “everyone uses it” mentality
Typical User Demographics:
- Age: 25-45 years (78% user base)
- Income: ₹25,000-₹80,000 monthly
- Location: 62% from tier-2 cities and smaller
- Usage: Daily essentials, bill payments, peer transfers
2. Google Pay (GPay) – The Tech Giant’s Choice (37% Market Share)
Consumer Behavior Profile: Google Pay maintains 37% market share through superior integration with Google’s ecosystem and sophisticated reward mechanisms that appeal to tech-savvy, reward-optimizing consumers.
Key Features Driving Consumer Adoption:
- Google Integration: Seamless Gmail, Maps, and Assistant connectivity
- Advanced Security: Google’s security infrastructure builds consumer confidence
- Smart Suggestions: AI-powered transaction categorization and insights
- Group Splitting: Appeals to social spenders and millennials
- Voice Commands: “Ok Google, pay…” functionality for hands-free payments
Consumer Psychology Insights:
- Ecosystem Lock-in: Google users find switching costs high
- Tech Credibility: Google brand provides security assurance
- Gamification: Scratch cards and rewards create dopamine-driven engagement
Typical User Demographics:
- Age: 22-40 years (72% user base)
- Income: ₹30,000-₹1,20,000 monthly
- Location: 58% from metro and tier-1 cities
- Usage: Online shopping, entertainment, premium services
3. Paytm – The Pioneer’s Resilience (7% Market Share)
Consumer Behavior Profile: Despite market share decline, Paytm retains 7% market share through loyalty among early adopters and comprehensive financial services integration that appeals to all-in-one solution seekers.
Key Features Driving Consumer Retention:
- Comprehensive Ecosystem: Wallet, payments, investments, insurance in one app
- Merchant Network: Extensive offline acceptance network
- Paytm Bank Integration: Full banking services within payment app
- Travel and Entertainment: Movie tickets, flights, hotels booking
- Business Solutions: Appeals to small merchants and freelancers
Consumer Psychology Insights:
- Sunk Cost Fallacy: Long-term users resist switching due to invested time
- One-Stop Solution: Reduces app switching for financial tasks
- Merchant Loyalty: Business users prefer integrated payment-business tools
Typical User Demographics:
- Age: 28-50 years (65% user base)
- Income: ₹20,000-₹75,000 monthly
- Location: Mixed across all city tiers
- Usage: Business transactions, comprehensive financial management
4. Amazon Pay – The E-commerce Integrator (3% Market Share)
Consumer Behavior Profile: Amazon Pay users are ecosystem loyalists who prioritize seamless shopping experiences and reward optimization within familiar platforms.
Key Features Driving Consumer Adoption:
- Amazon Integration: Cashback and rewards for UPI payments on Amazon and partner platforms
- Prime Benefits: Enhanced rewards for Prime members
- Cashback Focus: Consistent cashback offers on partner merchants
- Shopping Convenience: One-click payments for Amazon purchases
- Split Bills: Group payment features for shared purchases
Consumer Psychology Insights:
- Shopping Habits: Appeals to frequent Amazon shoppers
- Reward Optimization: Users strategically use for maximum cashback
- Trust Transfer: Amazon’s e-commerce credibility extends to payments
Typical User Demographics:
- Age: 25-45 years (e-commerce active demographic)
- Income: ₹35,000-₹1,00,000 monthly
- Location: Metro and tier-1 cities (68%)
- Usage: Online shopping, bill payments, entertainment
5. CRED – The Premium Player (1% Market Share)
Consumer Behavior Profile: CRED maintains 1% market share but commands high-value transactions from premium consumers who value exclusive experiences over mass-market features.
Key Features Driving Consumer Adoption:
- Credit Card Management: Bill payment rewards and credit score monitoring
- Exclusive Rewards: Premium brand partnerships and exclusive deals
- Curated Experiences: High-end restaurant, travel, and lifestyle offers
- Investment Options: Mutual funds and premium investment products
- Elite Community: Members-only features and experiences
Consumer Psychology Insights:
- Status Symbol: App usage signifies financial sophistication
- Quality over Quantity: Users prioritize premium experiences
- Credit Optimization: Appeals to credit-conscious consumers
Typical User Demographics:
- Age: 28-45 years (high-income professionals)
- Income: ₹75,000+ monthly
- Location: Metro cities (85%)
- Usage: Credit card payments, premium purchases, investments
6. BHIM – The Government’s Digital Initiative (2% Market Share)
Consumer Behavior Profile: BHIM users represent security-conscious consumers and government service supporters who prioritize transparency and official backing over flashy features.
Key Features Driving Consumer Adoption:
- Government Backing: NPCI’s official app with government support and offers
- Multi-language Support: Available in multiple Indian languages
- Offline Functionality: Works without internet using *99# service
- Security Focus: Government-grade security protocols
- Simple Interface: Designed for mass adoption across literacy levels
Consumer Psychology Insights:
- Trust in Government: Appeals to users preferring official solutions
- Security First: Attracts risk-averse consumers
- Simplicity Preference: Users value straightforward functionality
Typical User Demographics:
- Age: 30-55 years (diverse age range)
- Income: ₹15,000-₹50,000 monthly
- Location: Balanced across all city tiers
- Usage: Basic payments, government services, peer transfers
7. Navi UPI – The Rising Star (1% Market Share)
Consumer Behavior Profile: Navi broke into top 5 UPI apps in September 2024, attracting young professionals and tech enthusiasts seeking innovative features and competitive rewards.
Key Features Driving Consumer Adoption:
- Personal Loan Integration: Quick loan approvals within payment app
- Investment Platform: Mutual funds and SIP investments
- Cashback Optimization: Competitive reward programs
- Clean Interface: Modern, intuitive user experience
- Financial Planning: Budgeting and expense tracking tools
Consumer Psychology Insights:
- Innovation Appetite: Appeals to early adopters
- Financial Growth: Users seek comprehensive financial solutions
- Brand Curiosity: Sachin Bansal’s involvement creates interest
Typical User Demographics:
- Age: 22-35 years (young professionals)
- Income: ₹25,000-₹80,000 monthly
- Location: Tier-1 and tier-2 cities (75%)
- Usage: Salary management, investments, daily transactions
8. Freecharge – The Recharge Specialist (1.5% Market Share)
Consumer Behavior Profile: Freecharge users are utility-focused consumers who primarily use digital payments for recharges and bill payments with strong cashback expectations.
Key Features Driving Consumer Adoption:
- Recharge Focus: Specialized mobile and DTH recharge platform
- Cashback Guarantees: Consistent cashback on recharge transactions
- Utility Payments: Comprehensive bill payment options
- Axis Bank Integration: Banking services integration
- Instant Transactions: Quick processing for time-sensitive payments
Consumer Psychology Insights:
- Utility Maximization: Users optimize for recharge-specific benefits
- Habitual Usage: Creates routine around essential payments
- Deal Hunting: Appeals to discount-seeking consumers
Typical User Demographics:
- Age: 25-50 years (broad demographic)
- Income: ₹20,000-₹60,000 monthly
- Location: Mixed across city tiers
- Usage: Mobile recharges, bill payments, utility transactions
9. MobiKwik – The Wallet Pioneer (1% Market Share)
Consumer Behavior Profile: MobiKwik users represent wallet-preferring consumers who like prepaid payment models and integrated financial services.
Key Features Driving Consumer Adoption:
- Wallet Integration: Strong wallet-based payment system
- Credit Line: ZIP (Buy now, pay later) facility
- Investment Options: Mutual fund and insurance integration
- Merchant Network: Extensive offline acceptance
- Cashback Programs: Regular promotional offers
Consumer Psychology Insights:
- Control Preference: Wallet users prefer prepaid spending control
- Credit Utilization: Appeals to credit-seeking consumers
- Brand Loyalty: Long-term users resist switching
Typical User Demographics:
- Age: 28-45 years
- Income: ₹25,000-₹70,000 monthly
- Location: Balanced distribution
- Usage: Controlled spending, credit utilization, merchant payments
10. JioMoney – The Telecom Integration (0.5% Market Share)
Consumer Behavior Profile: JioMoney users are Jio ecosystem participants who value telecom-payment integration and family account management.
Key Features Driving Consumer Adoption:
- Jio Ecosystem: Seamless integration with Jio services
- Family Accounts: Multiple user management under one account
- Telecom Payments: Specialized Jio service payments
- Retail Integration: Jio retail store payment integration
- Data Benefits: Additional data benefits for payment app usage
Consumer Psychology Insights:
- Ecosystem Loyalty: Jio users prefer integrated solutions
- Family Management: Appeals to family account managers
- Telecom Dependency: Users tied to Jio service ecosystem
Typical User Demographics:
- Age: 25-50 years (Jio user base)
- Income: ₹20,000-₹60,000 monthly
- Location: Strong in Jio-dominant regions
- Usage: Telecom payments, family transactions, retail purchases
Consumer Behavior Insights: What Drives UPI App Choice?
Cashback Psychology and Reward Optimization
UPI payment apps offering up to 5% cashback have transformed consumer behavior, creating reward-optimizing decision patterns where users:
- Multi-App Strategy: 67% users maintain 2-3 UPI apps for maximum benefits
- Category Optimization: Users choose specific apps for different transaction types
- Cashback Hunting: 78% research cashback offers before making payments
- Threshold Awareness: Users time transactions to meet minimum spend requirements
Trust and Security Behavior Patterns
Security-Conscious Consumer Segments:
- Government Backers: 34% prefer BHIM for government service payments
- Brand Loyalists: 45% stick to Google Pay/PhonePe for brand trust
- Feature Minimalists: 23% choose simple interfaces for security perception
Usage Pattern Analysis Across Demographics
Age-Based UPI App Preferences:
- 18-25 years: Google Pay (42%), PhonePe (35%), CRED (12%)
- 26-35 years: PhonePe (41%), Google Pay (38%), Amazon Pay (11%)
- 36-45 years: PhonePe (45%), Paytm (28%), BHIM (15%)
- 45+ years: BHIM (38%), PhonePe (34%), Paytm (20%)
Income-Based Selection Patterns:
- ₹15,000-₹30,000: PhonePe (52%), BHIM (25%), Paytm (15%)
- ₹30,000-₹60,000: PhonePe (45%), Google Pay (38%), Amazon Pay (9%)
- ₹60,000+: Google Pay (42%), CRED (25%), PhonePe (20%), Amazon Pay (8%)
Future Trends: Consumer Behavior Evolution in UPI Apps
Emerging Consumer Expectations for 2025-2026
- Voice-First Interactions: Growing demand for voice-enabled payments
- AR/VR Integration: Visual payment confirmations and shopping experiences
- Cryptocurrency Integration: Early adopter interest in crypto-UPI bridges
- AI-Powered Insights: Demand for spending analysis and financial advice
- Social Commerce: Integration with social media platforms for seamless purchases
Market Consolidation Impact on Consumer Choice
The PhonePe and Google Pay duopoly with 86% combined market share creates both benefits and limitations for consumers:
Benefits:
- Standardized user experiences across platforms
- Extensive merchant acceptance networks
- Competitive cashback and reward programs
- Reliable transaction processing
Limitations:
- Reduced innovation pressure on market leaders
- Limited differentiation in core features
- Potential for reduced consumer benefits over time
- Dependency on two major platforms for digital payments
Strategic Recommendations for Consumers
Optimal UPI App Strategy for Different User Types
For Reward Maximizers:
- Primary App: Google Pay or PhonePe for general transactions
- Secondary App: CRED for credit card payments and premium rewards
- Tertiary App: Amazon Pay for e-commerce purchases
- Strategy: Rotate based on current cashback offers and spend categories
For Security-Conscious Users:
- Primary App: BHIM for government-backed security
- Secondary App: PhonePe for merchant acceptance
- Strategy: Limit to 2 apps, enable all security features, regular monitoring
For Business Users:
- Primary App: Paytm for comprehensive business tools
- Secondary App: PhonePe for peer payments and general transactions
- Strategy: Separate business and personal payment apps
For Tech Enthusiasts:
- Primary App: Google Pay for ecosystem integration
- Secondary App: Navi or CRED for innovative features
- Strategy: Early adoption of new features, regular app switching for testing
Frequently Asked Questions (FAQ)
Which is the best UPI app in India for 2025?
PhonePe leads with 48% market share due to superior merchant acceptance and reliability. However, the “best” app depends on individual needs: Google Pay for tech integration, CRED for premium users, BHIM for security-conscious consumers, and Amazon Pay for frequent online shoppers.
Do UPI apps really provide cashback on all transactions?
No, cashback offers are typically promotional and category-specific. Most apps provide cashback on selected merchants, minimum transaction amounts, or limited-time offers. UPI cashback comes in various forms including flat cashback and percentage-based rewards, but terms and conditions apply.
Is it safe to use multiple UPI apps on the same phone?
Yes, using multiple UPI apps is safe and common. 67% of users maintain 2-3 UPI apps for reward optimization. Each app has independent security protocols, and you can link different bank accounts to different apps for better financial management and security distribution.
Why do PhonePe and Google Pay dominate the UPI market?
PhonePe and Google Pay control 86% market share due to first-mover advantage, extensive marketing, superior user experience, comprehensive merchant networks, and strong financial backing. Their duopoly benefits from network effects where popularity drives further adoption.
Which UPI app offers the highest cashback in 2025?
Cashback offers vary frequently, but Amazon Pay, CRED, and newer apps like Navi typically offer competitive rewards. Some apps offer up to 5% cashback on specific categories. The highest effective cashback depends on your spending patterns and active promotional offers.
Can I link the same bank account to multiple UPI apps?
Yes, you can link the same bank account to multiple UPI apps using different VPA (Virtual Payment Address) formats. However, each app requires separate registration and verification. This allows you to choose the best app for different transaction types while using the same underlying bank account.
What makes CRED different from other UPI apps?
CRED targets high-income users with credit scores above 750, focusing on credit card bill payments and premium rewards. Unlike mass-market apps, CRED offers exclusive experiences, luxury brand partnerships, and investment options, making it a lifestyle-oriented payment platform rather than just a transaction tool.
Are new UPI apps like Navi worth switching to?
Navi’s entry into top 5 UPI apps demonstrates potential in innovative features and competitive rewards. New apps often offer better initial incentives to attract users. However, consider factors like merchant acceptance, reliability, and long-term feature roadmap before making it your primary payment app.
How do UPI apps make money if they provide cashback?
UPI apps monetize through merchant fees (MDR where applicable), advertising, cross-selling financial products (loans, investments, insurance), data insights, and interchange fees. Cashback is a customer acquisition cost that’s offset by revenue from these sources and increased user lifetime value.
Which UPI app is best for business transactions?
Paytm offers comprehensive business solutions including invoicing, inventory management, and business analytics. PhonePe Business and Google Pay for Business provide dedicated merchant features. Choose based on your business size: Paytm for comprehensive needs, PhonePe/Google Pay for simple merchant payments.
